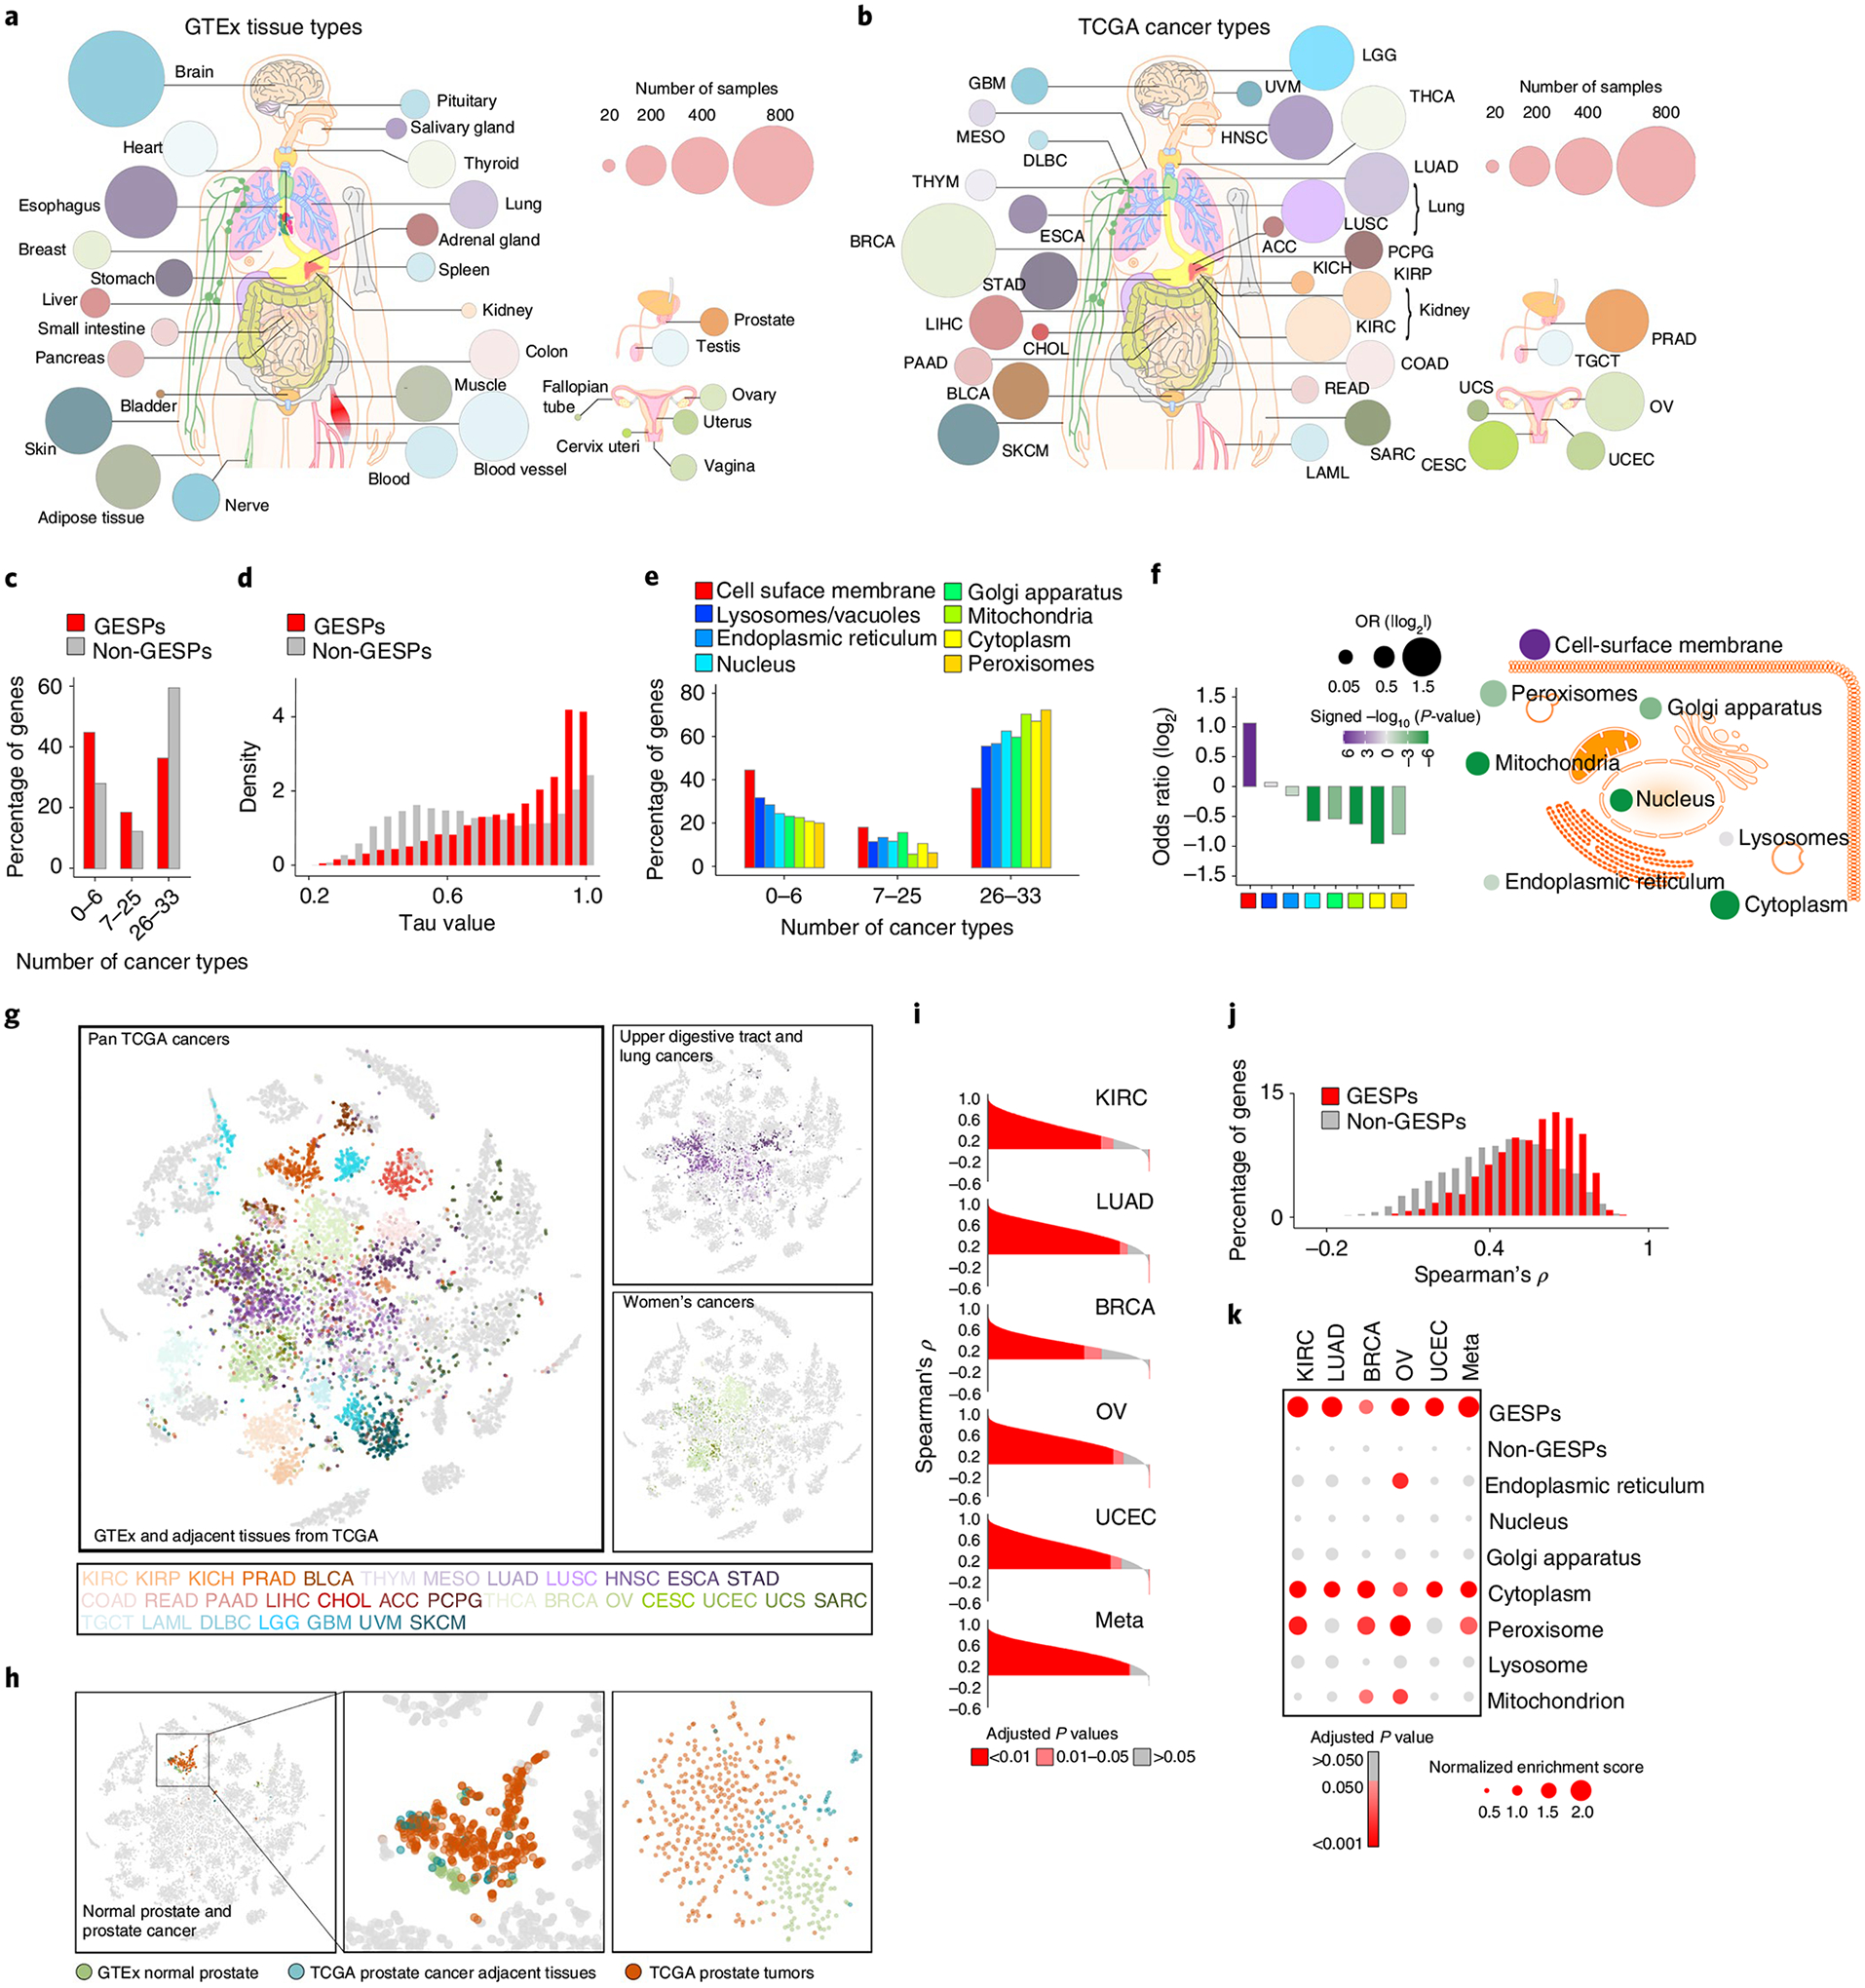
Fig. 2 |. Expression of GESPs across healthy normal tissues and primary tumor specimens.

a,b, Summary of the tissue/cancer types and numbers of RNA-seq specimens of GTEx (a) and TCGA (b) cohorts. The size of each circle corresponds to the number of samples of a tissue/cancer type. c, Percentages of genes that were detectable by RNA-seq in 0–6, 7–25 and 26–33 cancer types. d, Histogram of relative frequency distributions of tau values in GESPs and non-GESPs. e, The percentages of genes detectable in 0–6, 7–25 and 26–33 cancer types, stratified by subcellular location of gene products. f, Bar plot (left) and bubble plot (right) showing enrichment of cancer-type-specific genes in the corresponding subgroups based on subcellular location of gene products. P values were calculated using two-sided Fisher’s exact test. Purple, enriched; green, depleted. The size of the bubble: absolute value of log2(OR). g, Based on GESP expression similarity, normal and tumor specimens were presented by t-SNE analysis. Normal and tumor-adjacent tissues: gray; tumor specimens: color coded (color key is listed at the bottom and based on tissue origin). Right: only the cancers derived from the upper digestive tract and lung epithelium (top right) or the women’s cancers (bottom right) are color coded; normal tissues and specimens from other cancer types are shown in gray. h, Left: specimens from normal prostate (GTEx, green), prostate tumor adjacent (TCGA; blue) and prostate tumors (TCGA, red) are highlighted. Other normal tissues and cancer specimens are shown in gray. Right: t-SNE analysis was performed only in the prostate specimens (normal, adjacent and tumors). i, Histogram of Spearman’s correlation coefficients between mRNA and protein expression levels of all genes across five cancer types. P values for Spearman’s rank correlation were calculated and adjusted using the Benjamini–Hochberg method. j, Histogram of frequency distributions of Spearman’s correlation coefficients between mRNA and protein expression levels in GESPs and non-GESPs. k, Bubble plot showing enrichment of positively correlated genes in the corresponding subgroups based on subcellular location of gene products. P values for the GSEA test were based on 1,000 permutations, and adjusted for gene set size and multiple hypotheses testing.
