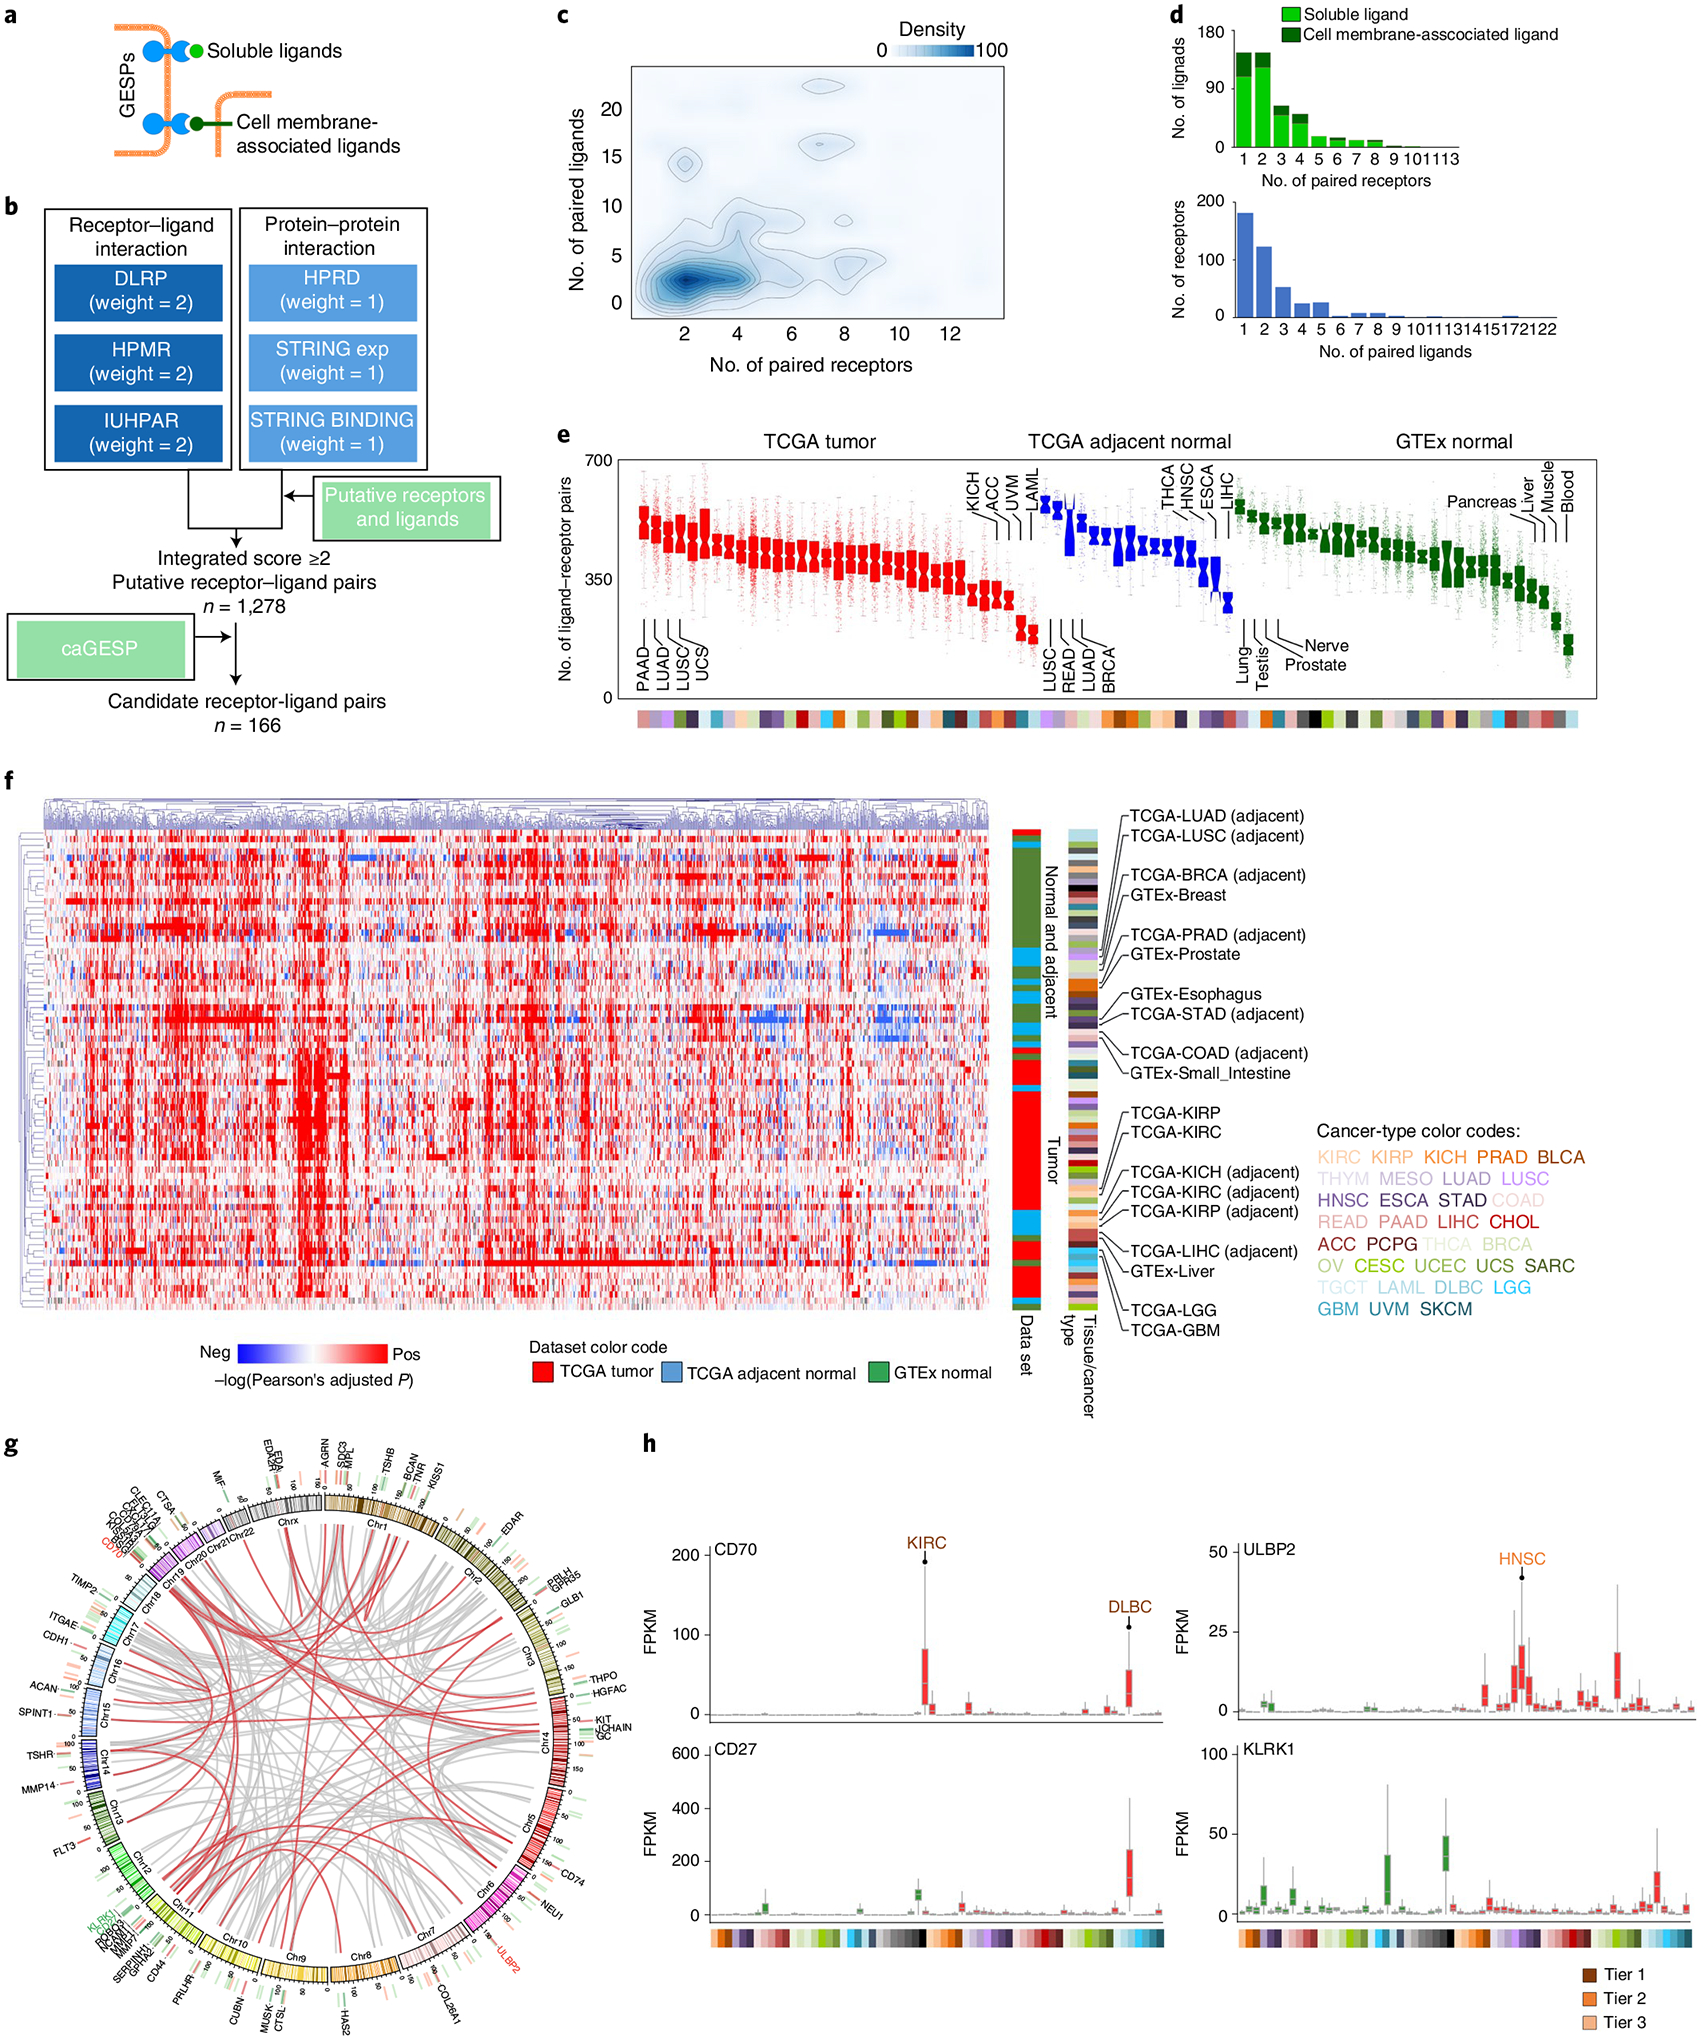
Fig. 6 |. Characterization of receptor–ligand interactions of the GESPs in cancers.

a, Schematic illustration of receptor GESPs and their soluble and membrane-associated ligands. b, The workflow to identify receptor–ligand interaction pairs. c, Density cloud plot showing the binding patterns of receptors and ligands. A given receptor (x axis) is plotted against the number of its corresponding ligands (y axis), and a given ligand (y axis) is plotted against the number of its corresponding receptors (x axis). d, Top: bar plots showing the numbers of ligands that bind to different numbers of their corresponding receptors. Bottom: bar plots showing the numbers of receptors that bind to different numbers of their corresponding ligands. e, Number of expressed receptor–ligand pairs in TCGA tumors, TCGA adjacent normal tissues and GTEx normal tissues. On the violin plot, points represent estimates for individual samples, and the colored areas are estimated density distributions. The sample size used to derive statistics is reported in Supplementary Tables 3 and 4. f, Unsupervised hierarchical cluster heatmap based on the correlations (log(transferred adjusted P value) of Pearson’s test) of expression levels of receptor–ligand pairs across TCGA tumors, TCGA adjacent normal tissues and GTEx normal tissues. Selected tissue/cancer types are highlighted on the right. g, Circle plot showing the interactions of the caGESP-associated receptor–ligand pairs. The receptor–ligand interactions are highlighted by a red color when a receptor is paired with at least one unique ligand. Red and green bars indicate genomic locations of the receptors and ligands, respectively. The names of two identified receptor–ligand pairs that have been used for CAR-T development in the clinic are highlighted by color. h, Examples of identified caGESP–ligand pairs that have been used for CAR-T development in the clinic: CD70–CD27 (left) and ULBP2–KLRK1 (right). Red text: the cancer type in which the caGESPs are highly expressed; green text: the normal tissues in which the ligands are expressed. The horizontal line in the box plot indicates the median, and the whiskers indicate 1.5× IQR of the first and third quartiles. The sample size used to derive statistics is reported in Supplementary Tables 3 and 4.
