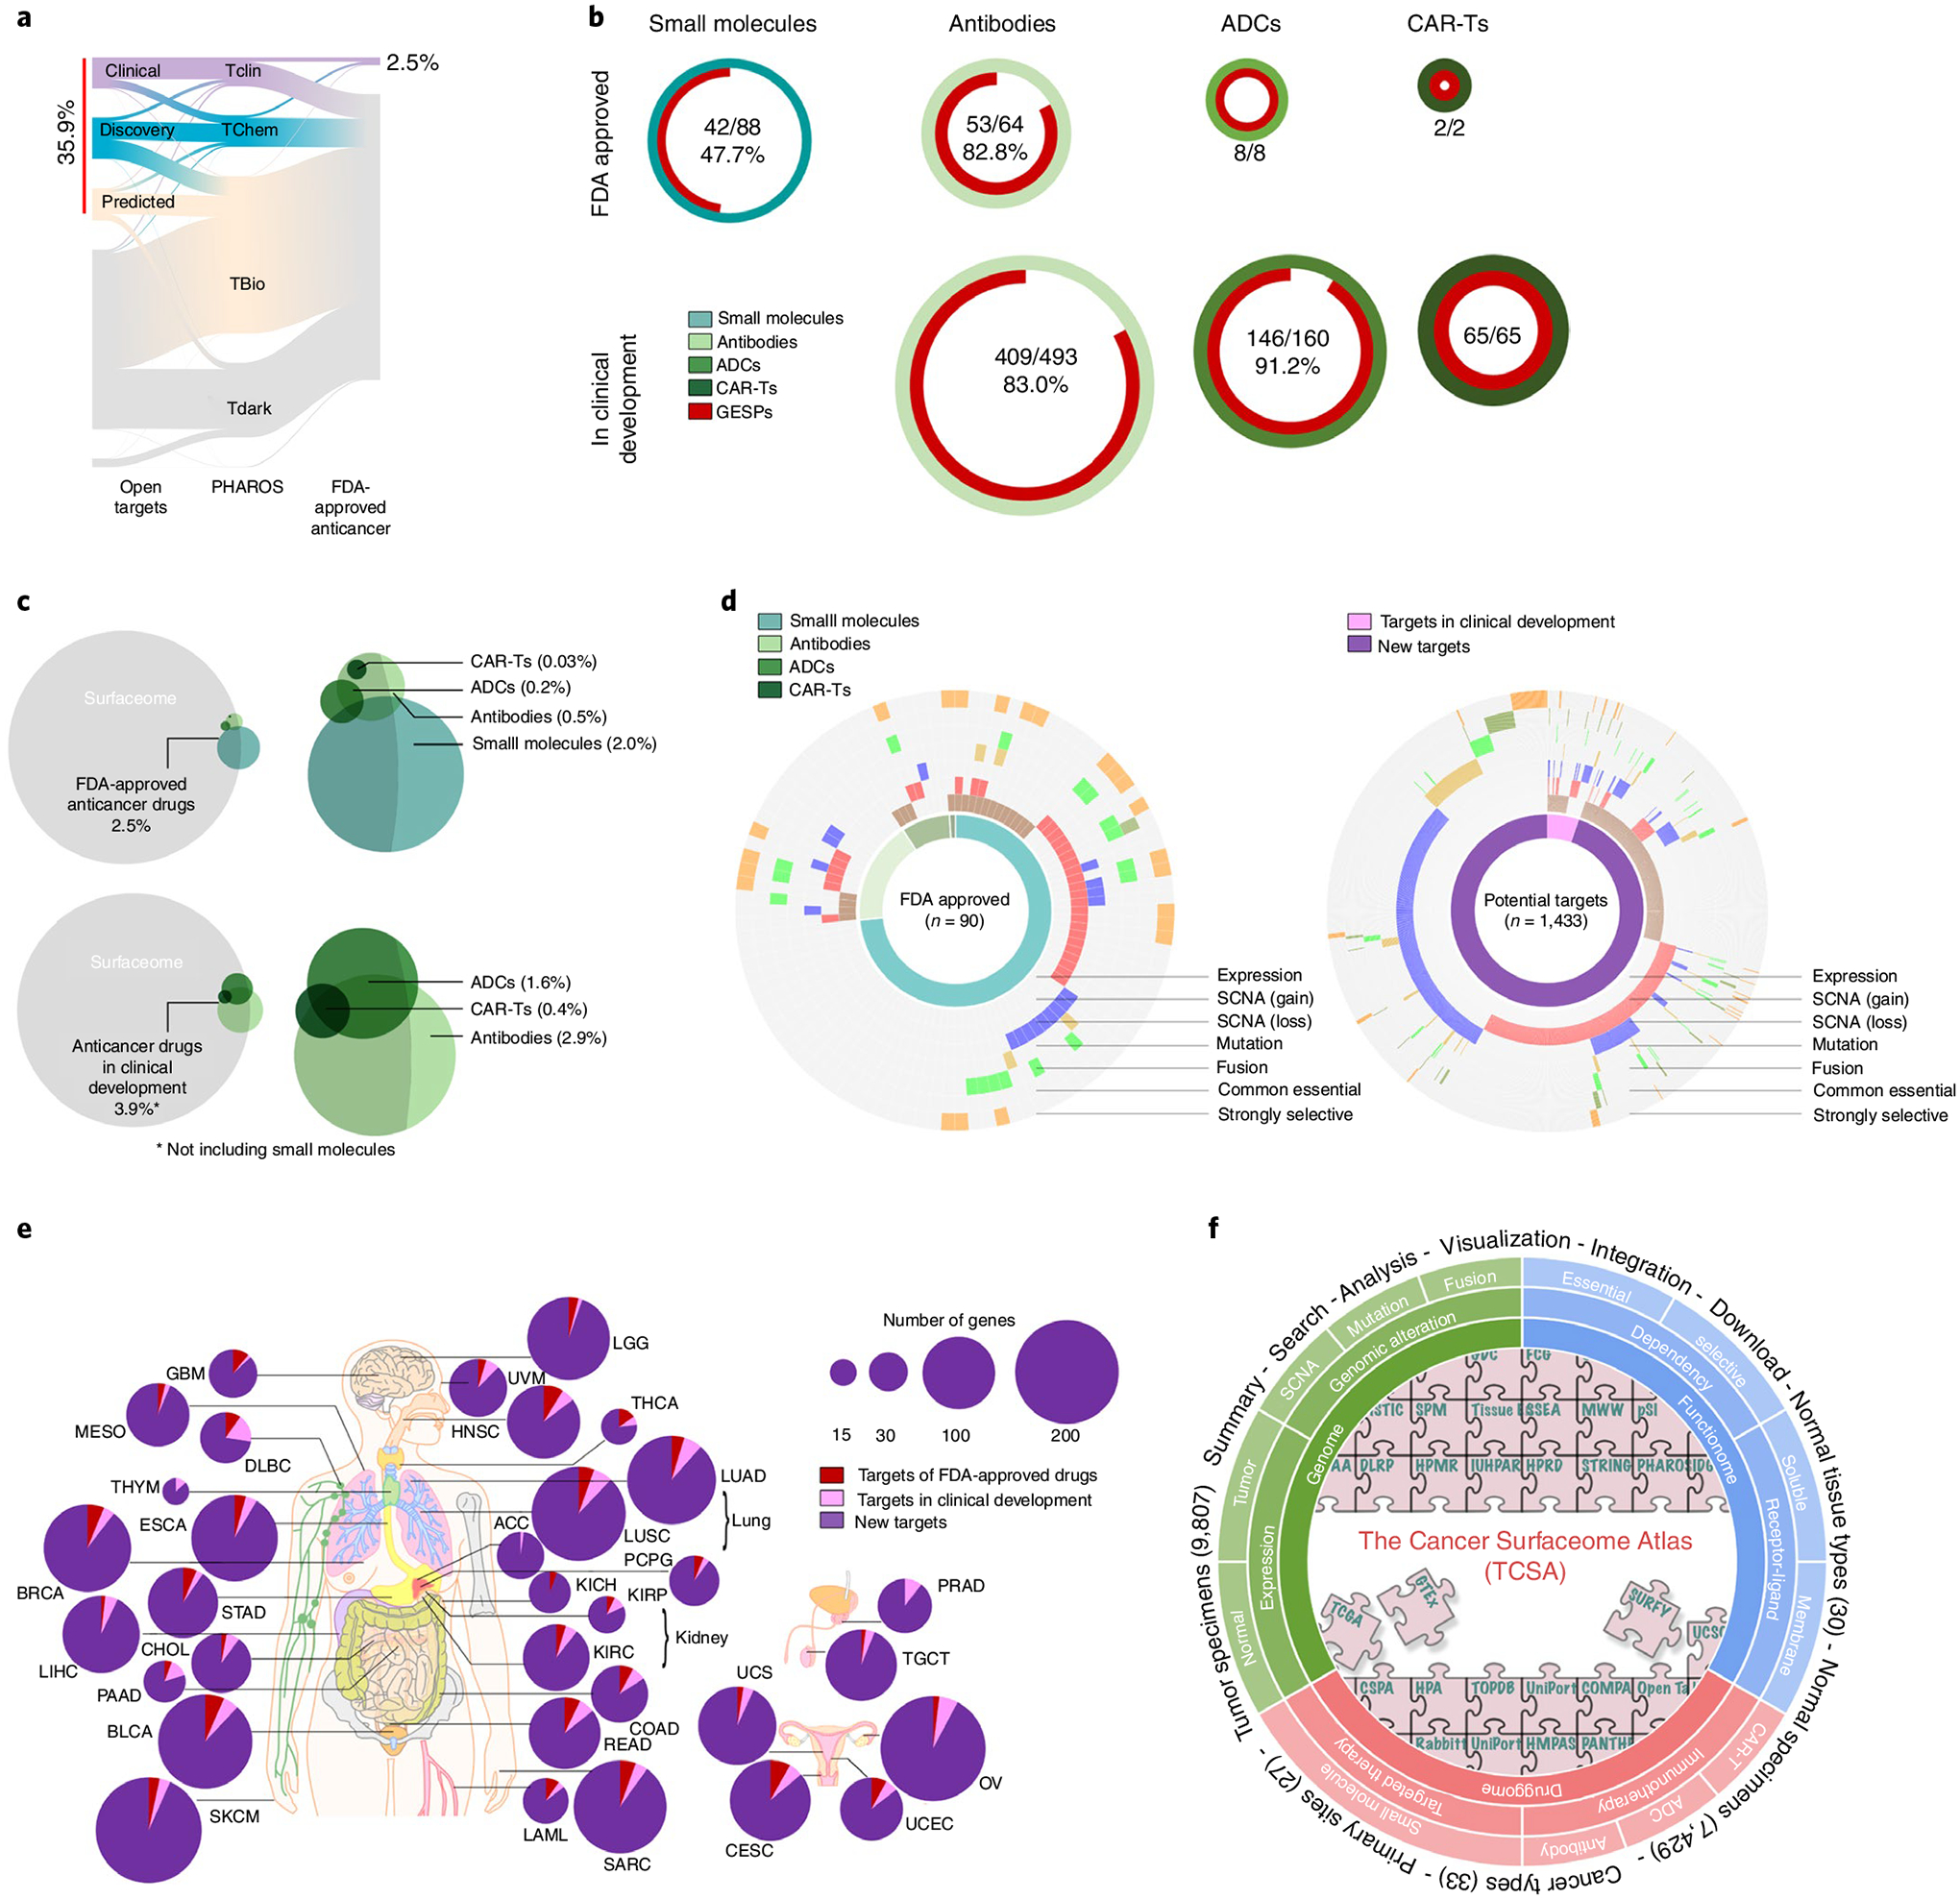
Fig. 8 |. Evaluation of GESPs as therapeutic targets in anticancer drug development.

a, River plot showing druggability of GESPs as small-molecule drug targets based on definition by the Open Target and PHAROS projects. The width of the bar is proportional to the number of GESPs at each druggability level. b, Proportion of GESPs (red) serving as direct targets for small molecule drugs (cyan), antibody drugs (light green), ADCs (green) and CAR-Ts (dark green) that have been approved (top) or are in clinical development (bottom) for cancer treatment. Ring size represents the number of drugs. c, Venn diagram showing the overlap between GESPs (gray) and target genes of small molecule drugs (cyan), antibody drugs (light green), ADCs (green) and CAR-Ts (dark green). Top: FDA-approved anticancer drugs; bottom: anticancer drugs in clinical development. d, Genomic and functional features identified in GESPs that are targets of FDA-approved anticancer drugs (left) or genes with therapeutic potential (right). The caGESPs: brown, recurrent SCNA gain: red; recurrent SCNA loss: blue; recurrent mutation: gold; recurrent fusion: green; common essential: olive; strongly selective: orange. e, Summary of GESPs that may serve as therapeutic targets for cancer treatment across 33 cancer types. The size of each circle corresponds to the number of identified GESPs in a given cancer type. Red: targets of FDA-approved anticancer drugs; pink: targets in clinical development; purple: targets identified in the present study. f, Overview of TCSA data portal. TCSA database integrates genomic, functional and pharmacological information on the human surfaceome across 33 cancer types.
