. 2022 Sep 16;21(12):1747–1756. doi: 10.1158/1535-7163.MCT-21-0875

Figure 1.

Figure 1. High content imaging showing anti-MMAE mAb staining after incubation of MDA-MB-468 cells with test agent (each at 1 μmol/L) n = 4–8; A, Composite showing nuclei stained with DAPI (Cyan), membrane marker (purple) anti-MMAE mAb (green); B, with 1 μmol/L Nectin-4 ADC; C, with 1 μmol/L BT8009; D, with 1 μmol/L MMAE; E, with non-binding BTC (BCY8781).

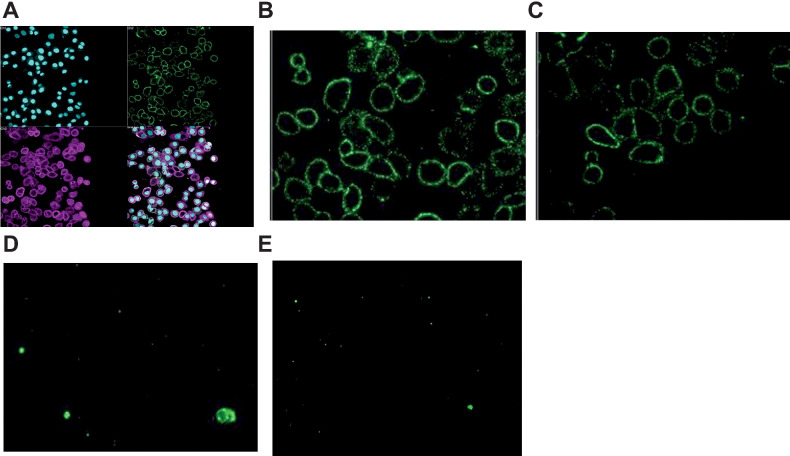
High content imaging showing anti-MMAE mAb staining after incubation of MDA-MB-468 cells with test agent (each at 1 μmol/L) n = 4–8; A, Composite showing nuclei stained with DAPI (Cyan), membrane marker (purple) anti-MMAE mAb (green); B, with 1 μmol/L Nectin-4 ADC; C, with 1 μmol/L BT8009; D, with 1 μmol/L MMAE; E, with non-binding BTC (BCY8781).