. 2022 Sep 16;21(12):1747–1756. doi: 10.1158/1535-7163.MCT-21-0875

Figure 4.

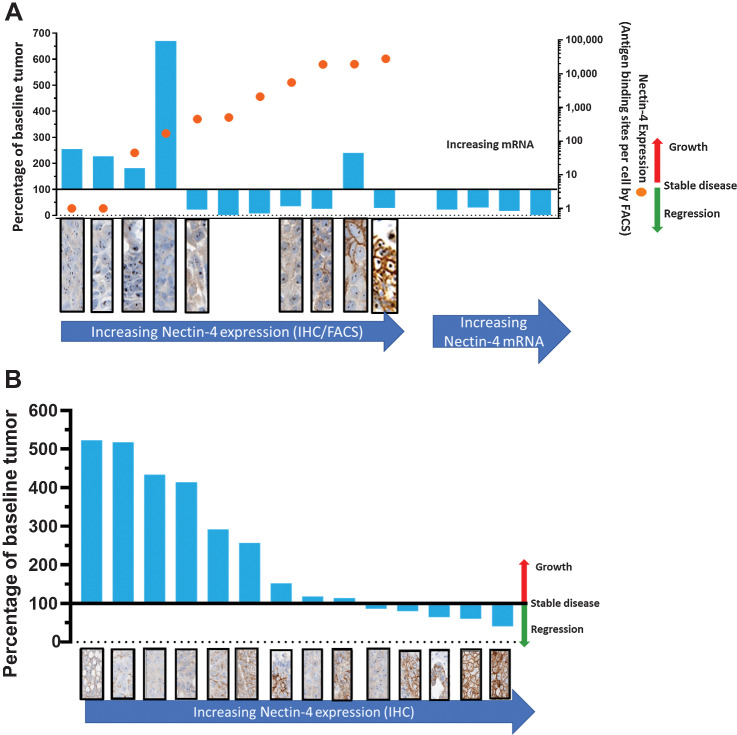
Figure 4. Relationship between BT8009 antitumor activity and target expression in CDX and PDX models; A, The percentage of change from initial tumor volume (blue columns–values above 100% indicate tumor growth, below 100% indicate tumor regression) and Nectin-4 expression assessed by FACS (orange circles, indicating antigen-binding sites per cell). FACS and IHC data are not available for 4 PDX models on right of A. IHC for Nectin-4 (stained brown) is shown in panels below the cell type; B, The percentage of change from initial tumor volume and Nectin-4 expression, assessed by IHC, in 14 NSCLC PDX models. Animals were dosed with 3 mg/kg BT8009, qw, in all studies.

Relationship between BT8009 antitumor activity and target expression in CDX and PDX models; A, The percentage of change from initial tumor volume (blue columns–values above 100% indicate tumor growth, below 100% indicate tumor regression) and Nectin-4 expression assessed by FACS (orange circles, indicating antigen-binding sites per cell). FACS and IHC data are not available for 4 PDX models on right of A. IHC for Nectin-4 (stained brown) is shown in panels below the cell type; B, The percentage of change from initial tumor volume and Nectin-4 expression, assessed by IHC, in 14 NSCLC PDX models. Animals were dosed with 3 mg/kg BT8009, qw, in all studies.