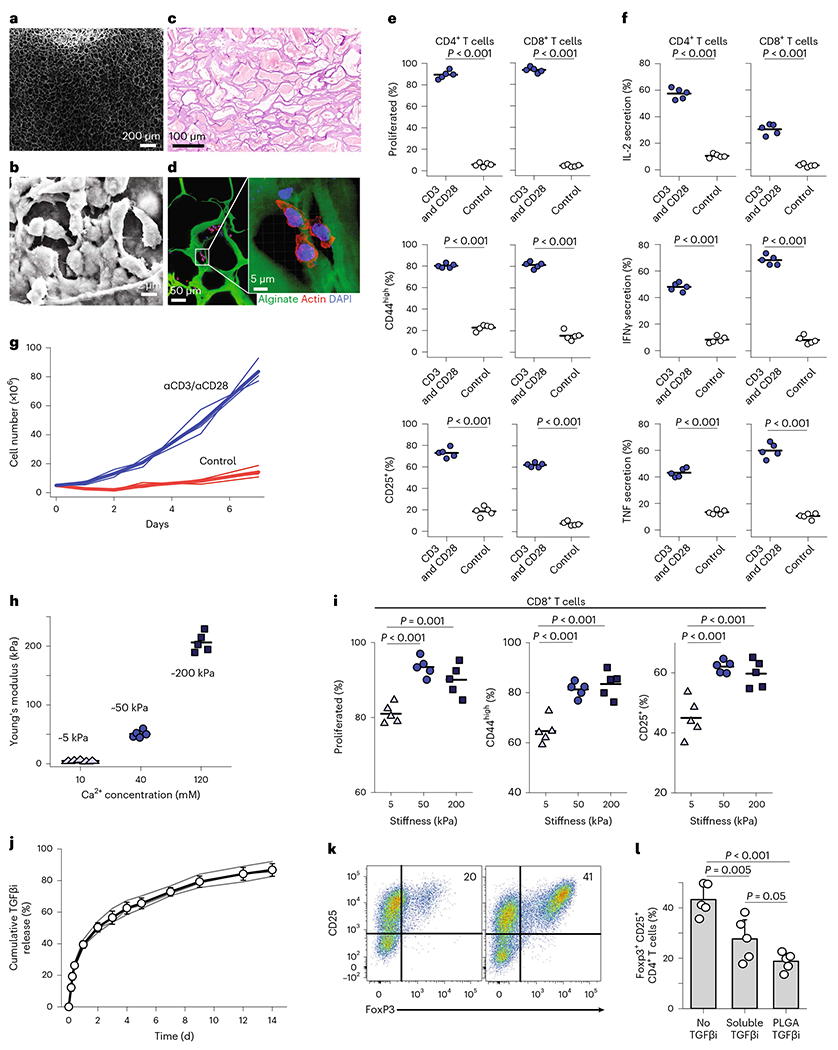
Fig. 1 |. Immunoactive scaffold activates T cells and suppresses Treg cells.

a, SEM images of macroporous scaffolds. Images were taken from a region within the bulk of the scaffold. b, Enlarged SEM images showing the association of T cells within the alginate-based scaffolds. Images were taken from an internal wall of the scaffold where T cells were aligned. c, To better assess the pore sizes of the scaffold in vivo, scaffolds were implanted in wild-type non-tumour-bearing mice for 7 days, with H&E staining showing connective tissue-like scaffolds. d, Confocal fluorescence images showing interaction of primary T cells with the scaffold. e–g, Activation and proliferation. e, Naive CD4+ and CD8+ primary mouse T cells co-cultured with 3D scaffolds. Scaffolds formulated by surface coating with stimulatory antibodies (anti-CD3 and anti-CD28) resulted in robust responses. Flow cytometry analysis of cell division and expression of activation markers CD25 or CD44 assayed 3 days after the introduction of T cells into the biomaterial. Proliferated (%) is the percentage of T cells that divided at least once. The percentage of T cells with high expression of CD44 and percentage of T cells upregulating CD25. f, Naive CD4+ and CD8+ primary mouse T cells co-cultured with 3D scaffolds. Scaffolds formulated by surface coating with stimulatory antibodies (anti-CD3 and anti-CD28) resulted in robust responses. Percentage of T cells expressing the effector cytokines IL-2, interferon gamma (IFNγ) or tumour necrosis factor (TNF). Each dot represents one independent experiment. Flow cytometry analysis of Treg-cell formation using antigen-presenting scaffolds in the absence (left) and presence (right) of TGFβi releasing NPs 4 days into culture. g, Naive CD4+ and CD8+ T cells co-cultured with various formulations of 3D scaffolds. The starting number of T cells was 5 × 10⁶ cells. Absolute counts of viable T cells in scaffolds fabricated with different formulations shows the robust expansion of T cells. Each line represents an independent experiment. h,i, Mechanical stiffness. h, Elastic modulus of the 3D alginate scaffold fabricated with three different concentrations of Ca2+. i, Proliferation and activation markers of T cells in scaffolds of various mechanical stiffness. j–l, TGFβ inhibition. j, Release of TGFβi encapsulated PLGA NPs embedded in the 3D alginate scaffold. The released TGFβi was measured over time under gentle shaking (50 rpm) at 37°C. k, Flow cytometry analysis of Treg-cell formation using antigen-presenting scaffolds in the presence (left) and absence (right) of TGFβi releasing NPs 4 days into culture. l, Inhibition of Treg-cell development in 3D scaffold by soluble TGFβi versus PLGA-encapsulated TGFβi was quantified. The individual data are presented (n = 5). The results were statistically analysed using one-way ANOVA with post hoc analysis. Error bars indicate standard deviation (s.d.). In e, f and i, horizontal bars indicate means.
