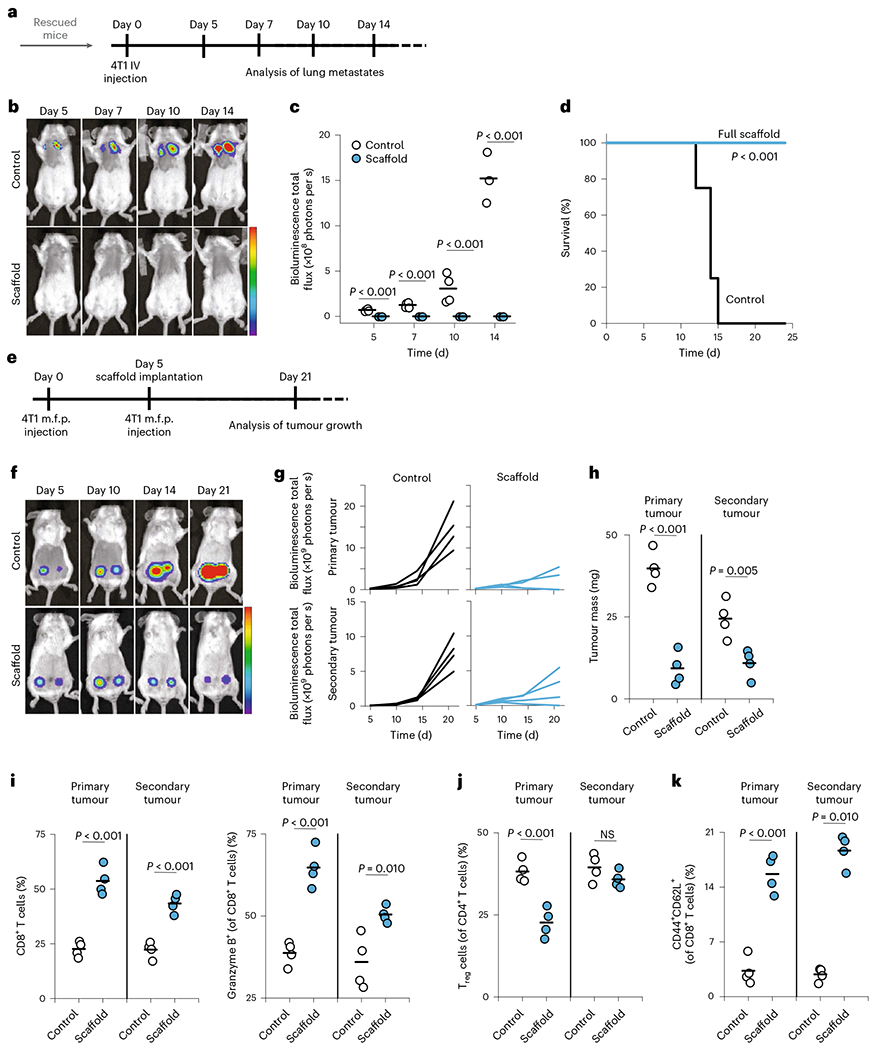
Fig. 3 |. Engineered scaffolds can suppress the growth of local and distant breast tumours and create anti-cancer memory.

a, Timing of IV injection of 4T1 breast cancer cells at 100 days post injection of primary tumours in mice that eliminated primary tumours (n = 4). Naive mice (age matched) receiving IV injection of 4T1 breast cancer cells were used as control. b, Representative bioluminescence imaging of luciferase-producing cancer cells at different times post injection of 4T1-Luc in mice treated with immunoactive scaffolds. c, Quantification of bioluminescence intensity of mice at different times post injection of 4T1-Luc cancer cells. d, Survival of mice after IV injection of 4T1 breast cancer cells in treated and control groups. e, Timing of inoculation of primary and secondary tumours and follow-up surgical implantation of the cell-free scaffolds. Wild-type, immunocompetent syngeneic mice were implanted in the mammary fat pad with 5 × 10⁵ 4T1-Luc breast cancer cells. After 5 days, the scaffolds were implanted, and 3 × 10⁵ tumour cells were injected into the contralateral mammary fat pad. f, Bioluminescence imaging of luciferase-producing cancer cells in mice treated with immunoactive scaffolds or (PBS) controls at various time points. g, Growth of primary and secondary 4T1 tumours in mice as quantified over time using bioluminescence imaging. h, Tumour masses were measured 15 days after inoculation of primary tumours in wild-type mice treated with immunoactive scaffolds. i, The frequency of CD8+ T cells and activated (granzyme B+) CD8+ T cells in primary and secondary tumours. j, The quantified frequency of Foxp3+CD25+CD4+ Treg cells in primary and secondary tumours. NS, not significant. k, The frequency of central memory (CD44+CD62L+CD8+) T cells in primary and secondary tumours (n = 4). Each point represents a mouse. Horizontal bars indicate means. The results were statistically analysed using one-way ANOVA.
