
Fig. 5. Quantitation of intrahepatic immune cells in CHB chimpanzees treated with GS-9620.
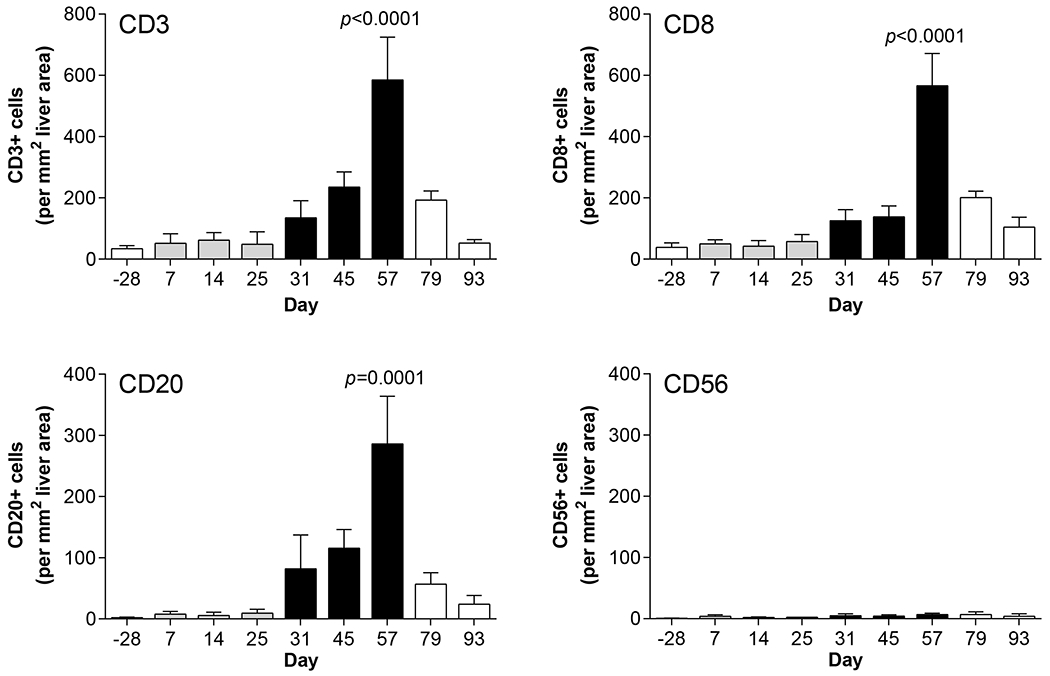
Number of lymphocytes in areas of immune cell aggregation on different study days as determined by quantitative image analysis. Bar height indicates the mean and error bars represent the SEM for all animals for which IHC slides were evaluable (n=2-3, except for n=1 on day 25 for CD56 labeling). Column color matches the study phase as described in Fig. 1A. Statistical significance relative to pre-treatment (day −28) was calculated by one-way ANOVA with Dunnett’s multiple comparison correction. Only p values <0.05 are labeled.