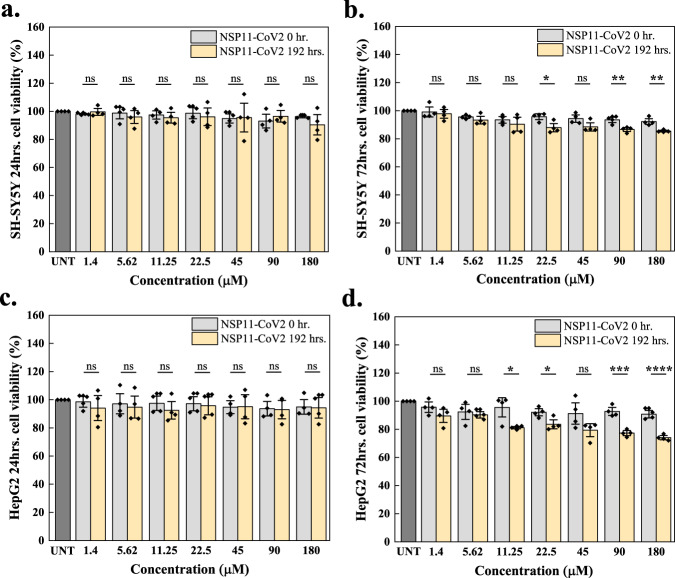
Fig. 10. Cell viability upon NSP11-CoV2 aggregation using MTT assay.
SH-SY5Y and HepG2 cells were treated with NSP11-CoV2 monomers (grey bars) and amyloid fibrils (192 h incubation; light yellow) for 24 h (a, c) and 72 h (b, d). The cells treated with media containing 20 mM sodium phosphate buffer (pH 7.4) were used as a control (dark grey bar; UNT is untreated). Diamond symbols on each bar indicate technical replicates and the error bars represent the SEM of these replicates. ns is a non-significant difference, *p < 0.05, **p < 0.01, ***p < 0.001, and ****p < 0.0001 according to the two-tailed Student’s t-test (no adjustments were made). Correspondingly, for 24 and 72 h treatment on SH-SY5Y cells, the respective p-values of monomer vs. aggregate are 0.8523, 0.7277 (1.4 μM), 0.5860, 0.3560 (5.62 μM), 0.6837, 0.4781 (11.25 μM), 0.4924, 0.0289 (22.5 μM), 0.9899, 0.0779 (45 μM), 0.5091, 0.0050 (90 μM), and 0.3101, 0.0063 (180 μM). For 24 and 72 h treatment on HepG2 cells, the respective p-values of monomer vs. aggregate are 0.1966, 0.0806 (1.4 μM), 0.5306, 0.6118 (5.62 μM), 0.0513, 0.0255 (11.25 μM), 0.1963, 0.0265 (22.5 μM), 0.9911, 0.0897 (45 μM), 0.8042, 0.0001 (90 μM), and 0.8208, <0.0001 (180 μM). The source data are given in the Source Data file.

