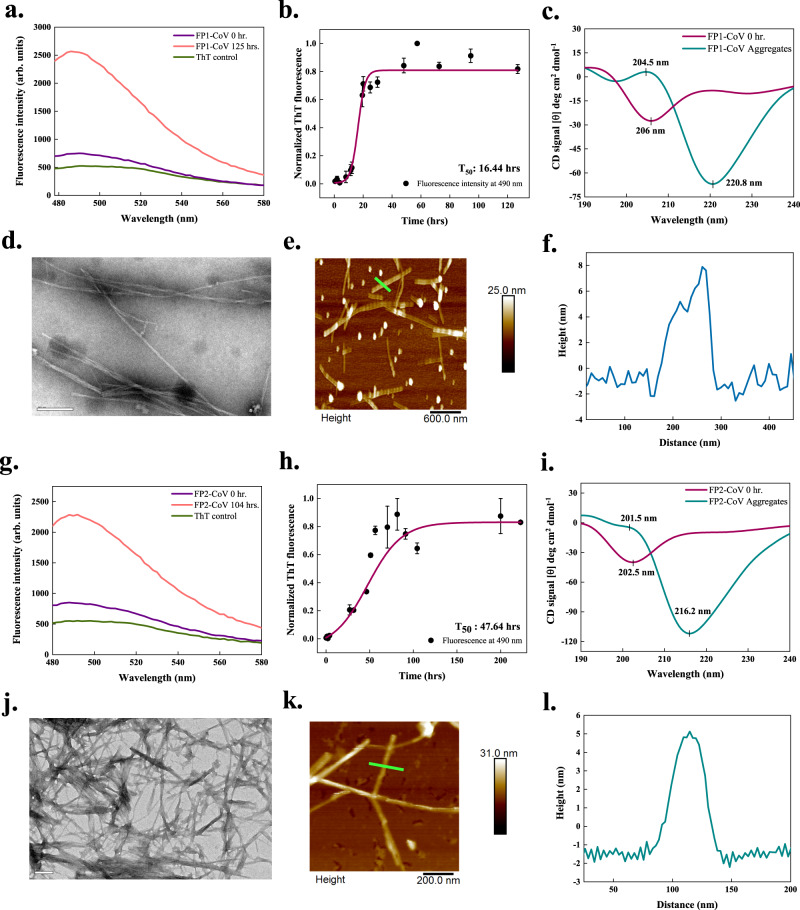
Fig. 3. In vitro aggregation of fusion peptides 1 (FP1-CoV) and 2 (FP2-CoV) of SARS-CoV S protein.
a, g ThT fluorescence scan (λex 440 nm) shows ~3.5- and ~3-fold increment at λmax with FP1-CoV and FP2-CoV incubated samples, respectively. b, h Aggregation kinetics monitored using ThT fluorescence. Each dotted symbol represents the average value of two (FP2-CoV) and three (FP1-CoV) technical replicates and error bar represents the SEM of these replicates. The wine-coloured lines show the sigmoidal fittings of data points that determines the T50 values as 16.44 ± 0.84 h and 47.64 ± 3.75 h for FP1-CoV and FP2-CoV peptides, respectively. c, i The secondary structure of 1 mg/ml monomeric and aggregated (240 h) peptides are investigated using CD spectroscopy. The spectra of the monomeric FP1-CoV show a negative peak at 206 nm, exposing a molten globule-like structure. For aggregates, two characteristic peaks, one positive at 204.5 nm and a negative peak at ~220 nm, show the presence of β-sheet rich secondary structure. Spectral data of FP2-CoV reveal disordered structure for monomer and β-sheet structure for aggregates. The spectra are smoothened with 10 points using FFT filter function. d, j FP1-CoV fibrils at 240 h appear to be longer, slender and twisted under HR-TEM. Whereas image of FP2-CoV aggregates (104 h) show highly branched and pointed fibrils; scale bar represents 100 nm and 200 nm for images shown in panels (d) and (j), respectively (11 and 17 TEM micrographs were captured for FP1-CoV and FP2-CoV peptides, respectively). (e, k) AFM imaging of FP1-CoV and FP2-CoV aggregates at 240 and 270 h; scale bars represent 600 nm and 200 nm. Four and 7 AFM micrographs were captured for FP1-CoV and FP2-CoV aggregated samples, respectively. Due to the double-tip effect during scanning, the imaged fibrils were blurry in panel (e). f, l Height profiles of FP1-CoV and FP2-CoV fibrils shown with green-coloured lines in panels (e) and (k), respectively. The source data are given in the Source Data file. Arb. units are arbitrary units.

