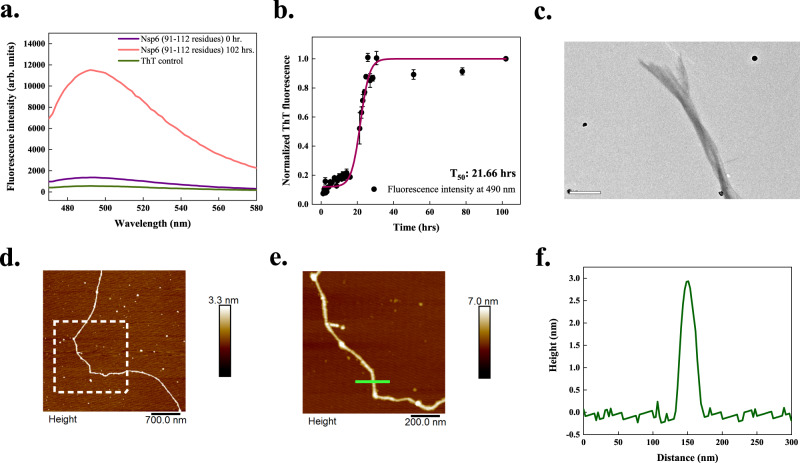
Fig. 6. In vitro aggregation of NSP6-p of SARS-CoV-2.
a ThT fluorescence scan (λex 440 nm) indicates an increase of ~10-fold at λmax with NSP6-p incubated sample. b Aggregation kinetics of NSP6-p monitored using ThT fluorescence. Each dotted symbol represents the average value of two technical replicates and error bar represents the SEM of these replicates. The wine-coloured line shows the sigmoidal fitting of data points that determines the T50 of this reaction to be 21.66 ± 0.8 h. c Under HR-TEM, 240 h incubated aggregates are longer and branched, possessing twisted morphology; the scale bar represents 500 nm. Four micrographs were captured from the same grid. d AFM image of NSP6-p fibrils at 96 h with scale bar 700 nm. e A zoomed-in image of a fibril shown in a white box in panel (d) with scale bar 200 nm. A total of 5 micrographs were captured from the same sample. f The height profile of NSP6-p fibril is indicated with a green-coloured line in panel (e). CD spectrum of NSP6-p aggregates is not shown as it produced high noise rendering the spectral data unreliable. The source data are given in the Source Data file. Arb. units are arbitrary units.

