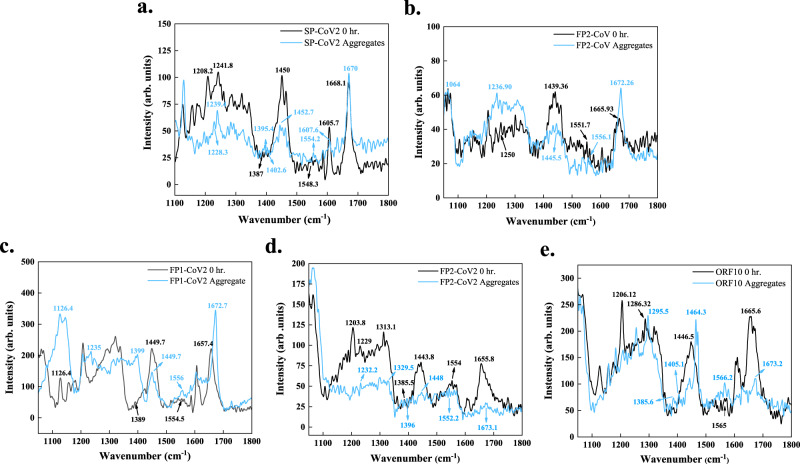
Fig. 8. Amyloid formation of SARS-CoV and SARS-CoV-2 peptides probed using Raman spectroscopy.
Raman spectra were acquired on excitation at 633 nm from wavenumber 1050 cm−1 to 2000 cm−1 for monomers and aggregates of a SP-CoV2, b FP2-CoV, c FP1-CoV2, d FP2-CoV2, and e ORF10. Apparent shifts in the positioning of various bands in spectra of aggregates from monomers were analyzed. Particularly, shifts in amide I-III bands and the Cα–H band are reported (see Supplementary Table 10). The spectral data was smoothened with 10 points using the FFT filter. The source data are given in the Source Data file. Arb. units are arbitrary units.

