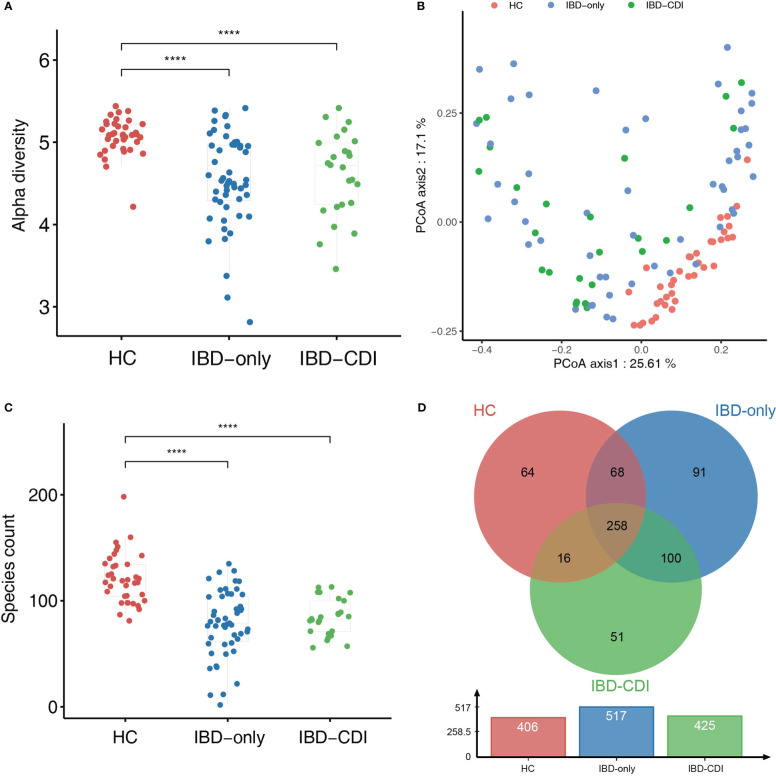
Figure 1.
Biodiversity of gut microbiome in the HC, IBD-only, and IBD-CDI groups. (A) The alpha diversity was measured in the Shannon index. (B) PCoA plots of the three study groups. (C) Box plots of the number of species among the three groups. (D) The venn diagram of the common and unique species among the three groups. ****P < 0.0001.

