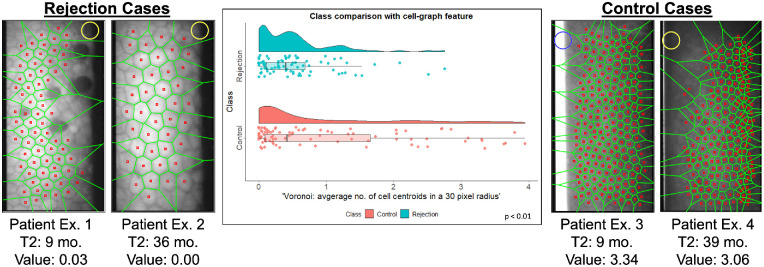
Figure 5.
Comparison of Delaunay triangulation feature between rejection (left) and control (right) patients. The two rejection images on the left were taken from a patient's eye 30 months and 36 months post-DMEK. The two control images on the right were taken from a patient's eye 25 and 32 months postkeratoplasty. The green graph arrangements overlaying each image is the corresponding Delaunay triangulation. The violin and box plots compare the distribution of Delaunay triangulation side length average calculated from control and rejection eye images.

