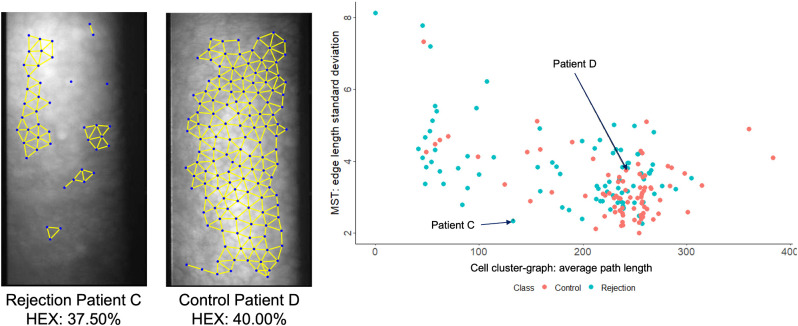
Figure 8.
Limitations of ECD as a distinguishing feature between rejection and control patients. Both rejection and control eye images showcase the same endothelial cell density. A scatterplot compares two features, Delaunay triangulation average triangle area and cell-cluster graph maximum eccentricity. The two data points corresponding to the two images are labeled in the scatterplot.

