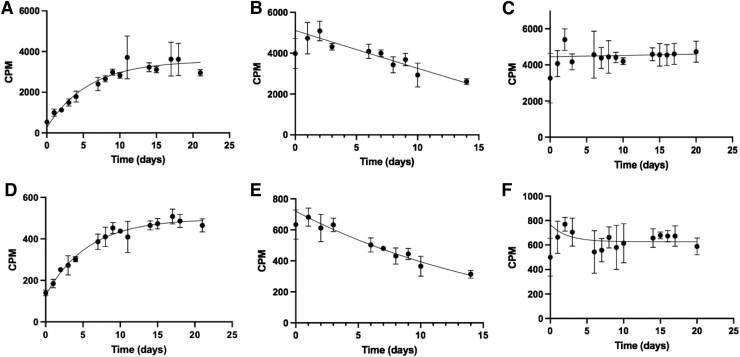
FIG. 3.
Readings at 1500 V (A–C) and at 1000 V (D–F) of each radioisotope and a mixed source spotted on cellulose support, measured over time. (A, D) 227Th CPM were plotted and fit according to a one-phase exponential decay. (B, E) 223Ra CPM were plotted and fit to a one-phase exponential decay. (C, F) Mixed source of 223Ra and 227Th. For all curves, the initial point is excluded from the exponential fitting to allow the system to reach equilibrium. Error bars indicate standard deviation between triplicates. CPM, counts per minute.

