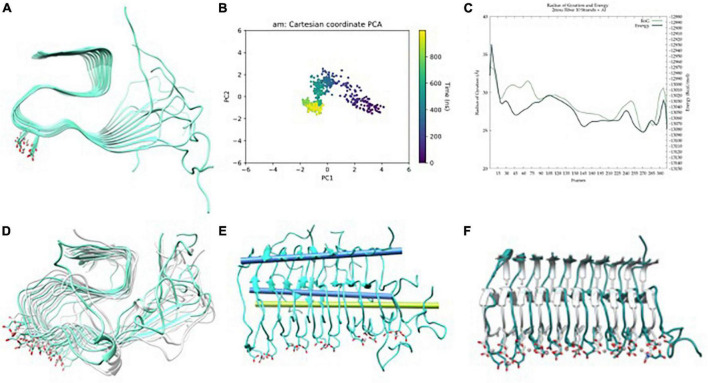
FIGURE 5.
(A) Aβ42-Al(III) model, (B) principle component analysis (PCA) of Gaussian accelerated molecular dynamics (GaMD) simulation, (C) energy profile and radius of gyration (RoG) along the GaMD simulation, (D) overlap of representative structures of most populated clusters obtained from GaMD simulations, (E) in blue, axis representation of 39–41 residues (top) and 13–15 residues β-sheets (bottom); in green; 13–16 β-sheets axis of NMR-structure, and (F) overlap between the solid-state NMR (ss-NMR) structure and the lowest energy structure of the GaMD simulation.

