Figure 3.
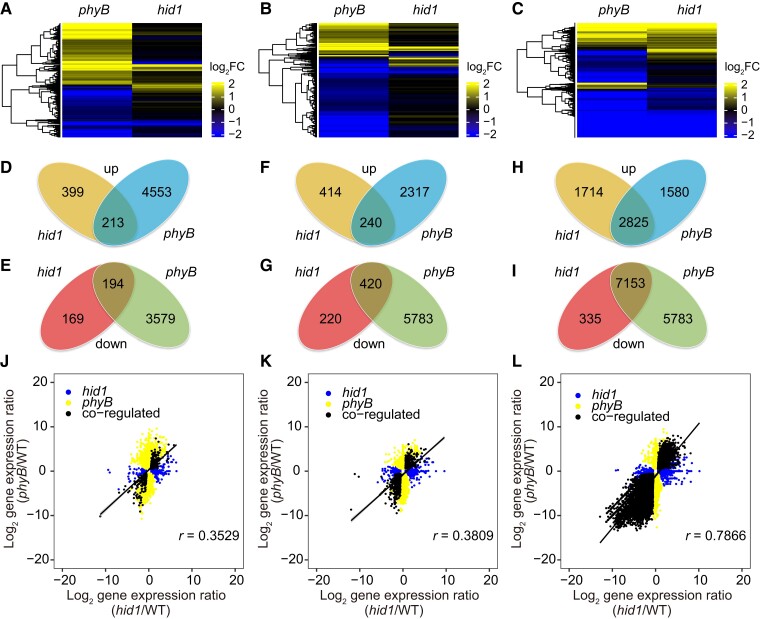
HID1 and phyB co-regulate a large set of genes at the transcriptional level at 48 h under phyB-on conditions. A–C, Cluster analysis of hid1- and phyB-regulated genes following 12, 24, and 48 h DAL under phyB-on conditions. The scale bar shows the log2 transformation of the ratio. D, F, and H, Venn diagrams showing the overlap between hid1- and phyB-upregulated genes following 12, 24, and 48 h DAL under phyB-on conditions. E, G, and I, Venn diagrams showing the overlap between hid1- and phyB-downregulated genes following 12, 24, and 48 h DAL under phyB-on conditions. J, K, and L, Correlation scatterplots of the log2 fold change values between hid1- and phyB-regulated genes at 12, 24, and 48 h under phyB-on conditions.

