Figure 6.
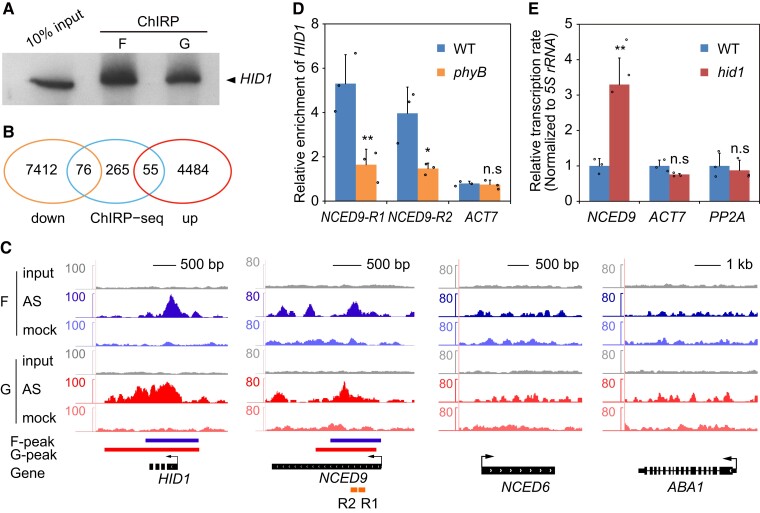
HID1 associates with the NCED9 locus and represses its transcription. A, RNA gel blots of HID1. F indicates 1% (v/v) formaldehyde crosslinking, and G indicates 1% (v/v) glutaraldehyde crosslinking. B, Venn diagram of HID1-regulated and HID1-bound genes identified by ChIRP-seq. The overlapping ChIRP peaks were identified by both formaldehyde- and glutaraldehyde-crosslinked ChIRP-seq. C, HID1 association with the NCED9 locus by ChIRP-seq. F indicates formaldehyde crosslinking and G indicates glutaraldehyde crosslinking. D, ChIRP-qPCR showing the differences in HID1 occupancy on chromatin at NCED9 in WT and phyB. Mean ± SD, n = 3. n.s, no significance. * P ≤ 0.05, ** P ≤ 0.01 (two-tailed Student's t-test). E, The nascent RNA levels of NCED9 in WT and hid1 seeds following 48 h DAL under phyB-on conditions were determined by the nuclear run-on assay. 5S rRNA was used as an internal control. Mean ± SD, n = 4. n.s, no significance. ** P ≤ 0.01 (two-tailed Student's t-test).

