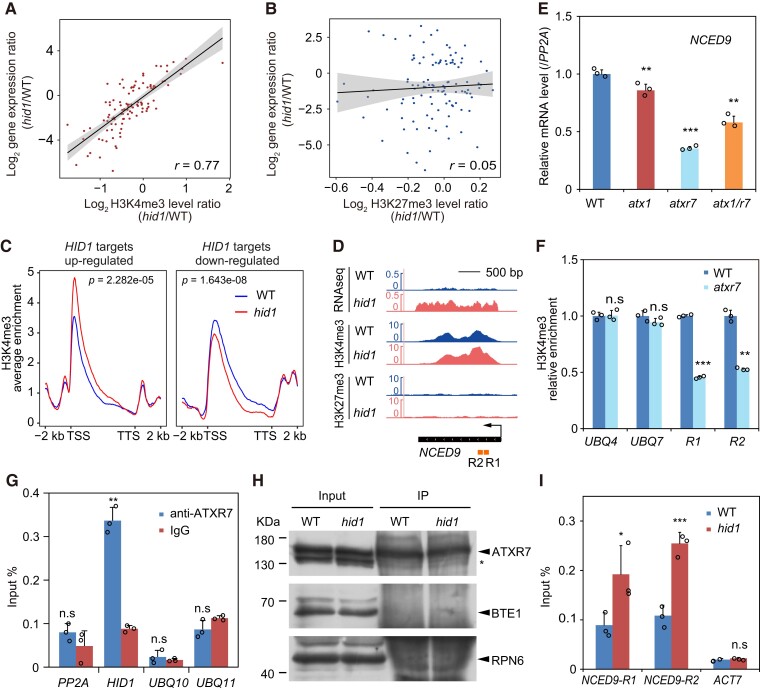
Figure 7.
HID1 antagonizes the accumulation of H3K4me3 and ATXR7 at the NCED9 locus. The correlation scatterplots show the log2 fold change values of the mRNA and H3K4me3 levels (A) and the H3K27me3 levels (B) in hid1 as compared with WT at 48 h under phyB-on conditions. r, Pearson's correlation coefficient. C, Meta-plots of the ChIP-seq signal of H3K4me3 for hid1-upregulated genes and hid1-downregulated genes in WT (blue curve) and hid1 (red curve). P value as indicated by the Wilcoxon rank-sum test. D, Integrative Genomics Viewer (IGV) screenshots of the RNA-seq, H3K4me3 ChIP-seq, and H3K27me3 ChIP-seq signals at NCED9. The gene model is shown at the bottom by the black bar. The arrow indicates the direction of transcription. E, RT-qPCR showing the mRNA levels of NCED9 in WT, atx1, atxr7, and atx1 atxr7 seeds following 48 h DAL under phyB-on conditions. Mean ± SD, n = 3. *** P ≤ 0.001 (two-tailed Student's t-test). F, ChIP-qPCR showing the relative enrichment of H3K4me3 on the indicated genes in WT and atxr7. Mean ± SD, n = 3. n.s, no significance. ** P ≤ 0.01, *** P ≤ 0.001 (two-tailed Student's t-test). UBQ4 and UBQ7 were used as controls. G, RIP-qPCR showing the association between ATXR7 and HID1. Mean ± SD, n = 3. n.s, no significance. ** P ≤ 0.01 (two-tailed Student's t-test). H, Immunoblots showing the protein expression levels of ATXR7 in the input and immunoprecipitates (IP) from WT and hid1. BTE1 and RPN6 were used as the loading controls. I, ChIP-qPCR showing the enrichment of ATXR7 at the indicated DNA regions of NCED9 in WT and hid1. ACT7 was used as the control. Mean ± SD, n = 3. n.s, no significance. *** P ≤ 0.001 (two-tailed Student's t-test).

