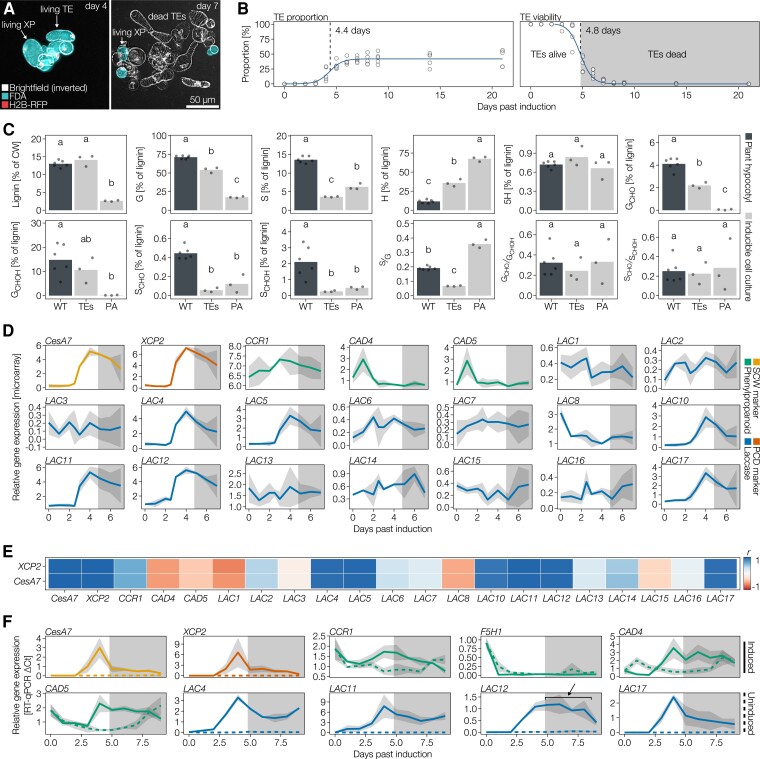
Figure 1.
Analyses of LAC and phenylpropanoid genes using inducible cell cultures to relate expression to lignifying and/or nonlignifying cell walls. A, Merged images of inducible cell cultures constitutively expressing a construct encoding nucleus-localized RFP (fused to histone H2B, H2B-RFP) induced with phytohormones to differentiate into tracheary elements (TEs) and xylem parenchyma (XP) at 4 and 7 days of culture. Images correspond to merged inverted brightfield (white), FDA staining indicating living cells (turquoise) and RFP-tagged nuclei (red). Note that XP remains living once TEs have undergone PCD before 7 days of culture. B, Temporal variation of TE differentiation and TE cell death. Note that the half-way time of TE differentiation plateau to reach ∼50% of all cells was reached by 4.4 days and the half-way time of TE cell death was 4.8 days, n = 6 independent time courses with 200 cells counted at each time point. C, Biochemical analysis of lignin in cell walls using pyrolysis/GC–MS to determine lignin amount and chemistry between lignifying TEs, dividing parenchyma and hypocotyls of WT plants. Lignin chemistry and levels are presented as summed percentage of the total pyrogram area, with each pyrolysate identified by its m/z profiles. Note, however, that no corrections for differences in response factor were made (H residue pyrolysates have a ∼five-fold higher relative response factor than GCHO and GCHOH, and a ∼eight-fold higher relative response factor than SCHO and SCHOH; Van Erven et al., 2017). Different letters indicate statistically significant differences between genotypes according to a Tukey-HSD test (α = 0.05); n = 3–6 independent samples per cell type or genotype. D, Expression data of the secondary cell wall (SCW) marker gene CESA7/IRX3, the PCD marker gene XCP2, phenylpropanoid biosynthesis genes and LAC paralogs during TE differentiation using microarray data from Derbyshire et al. (2015). Each line represents the average of n = 3 independent time courses with the gray ribbon indicating SD. The shaded area of the plot indicates the time after TE PCD. CCR1 catalyzes the production of XCHO phenylpropanoids (Mir Derikvand et al., 2008), CADs catalyze the production of XCHOH phenylpropanoids (Sibout et al., 2005). E, Correlation analyses to define the temporal co-regulation of LAC paralogs and phenylpropanoid genes with markers of SCW and TE PCD. F, RT-qPCR analysis of SCW and PCD marker genes as well as LAC and phenylpropanoid genes during the culture time course during lignified TE formation or division of parenchyma. Line represents the average of n = 3 independent time courses with the gray ribbon indicating SD. The shaded area of the plot indicates the time after TE PCD. F5H1 catalyzes Gx to Sx phenylpropanoids conversion (Meyer et al., 1998). The arrow indicates extended expression of LAC12 in induced conditions beyond TE PCD that shows expression in xylem parenchyma cells.

