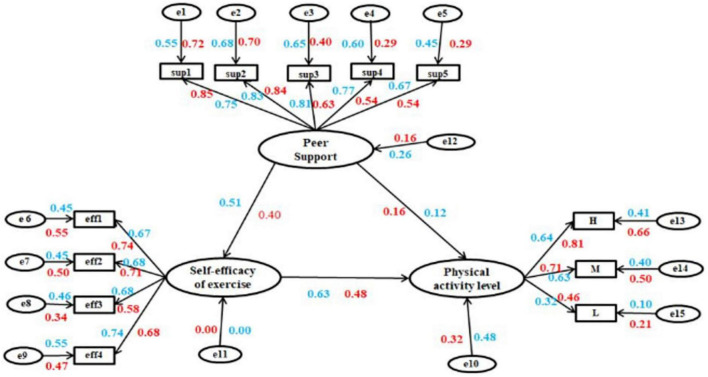
FIGURE 3.
The grouping structural equation model. The light blue represents the data of male college students, and red represents the data of female. In the male group: CMID/DF = 1.948, GFI = 0.905, AGFI = 0.855, RMSEA = 0.073, p = 0.001, CFI = 0.929, IFI = 0.932, RMSEA = 0.05–0.08, it indicated model-fit was good. In the female group: Model–fit indices was acceptable. CMID/DF = 2.204, GFI = 0.904, AGFI = 0.853, RMSEA = 0.083, p = 0.001, CFI = 0.908, IFI = 0.911, RMSEA = 0.08–0.10, it indicated that model-fit was acceptable.

