. 2023 Jan 24;12:e80428. doi: 10.7554/eLife.80428

Figure 1. Anti-Spike antibody levels stratified by cohort and vaccination status at Q2 and Q4 antibody testing.

Dot and box plots showing distribution of anti-Spike antibody levels within Avon Longitudinal Study of Parents and Children (ALSPAC) and TwinsUK, for those not vaccinated or individuals single-, double- or triple-vaccinated at time of sampling. Data shown for individuals sampled at least 4 weeks after first vaccination, and at least 2 weeks after second or third vaccination to allow time for antibody generation. Length of box plot whiskers are limited to 1.5 times the interquartile range. Red lines show 10th percentile levels. Assay upper limit is shown by black dotted lines, with 0.4–250 BAU/mL range for Q2 results and 0.4–25000 BAU/mL for Q4 results, with a positive threshold of 0.8 BAU/mL. Percentage of values above assay upper limit is given on right side of plots.

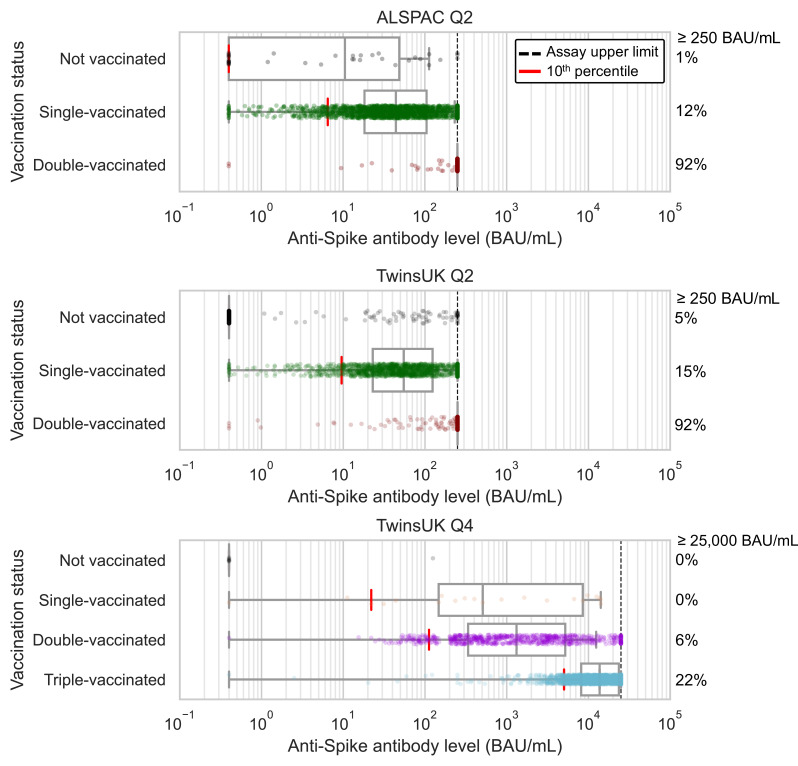
Figure 1.

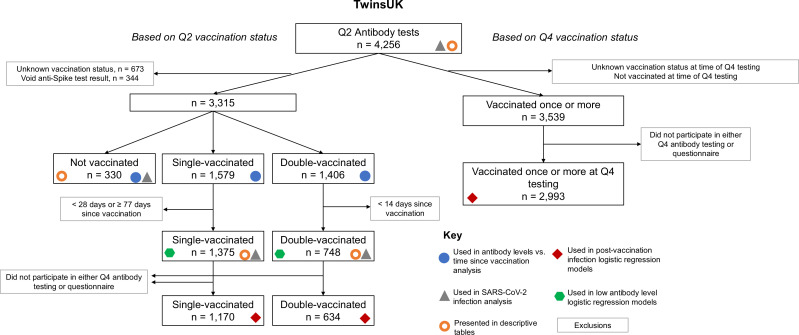
Figure 1—figure supplement 1. Flow chart showing identification of analysis samples from Q2 antibody testing within TwinsUK.

Figure 1—figure supplement 1.

The use of groups of individuals in various analyses is highlighted with symbols. Unknown vaccination status included a small number of individuals with contradictory vaccination dates (e.g., first vaccination dated after second vaccination), in addition to those who did not complete vaccination status questions.
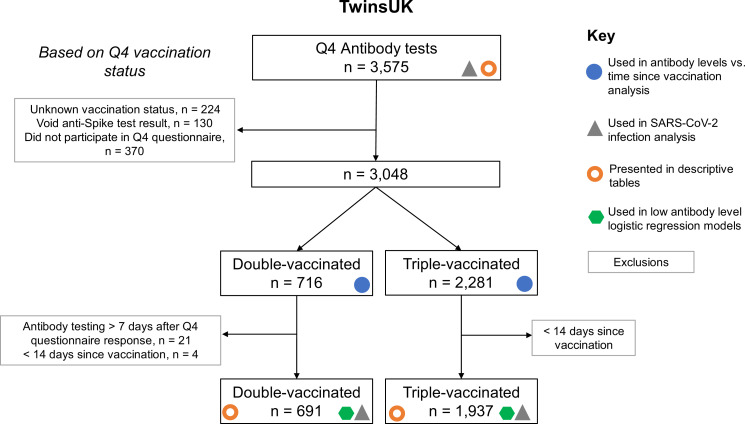
Figure 1—figure supplement 2. Flow chart showing identification of analysis samples from Q4 antibody testing within TwinsUK.

Figure 1—figure supplement 2.

The use of groups of individuals in various analyses is highlighted with symbols. Unknown vaccination status included a small number of individuals with contradictory vaccination dates (e.g., first vaccination dated after second vaccination), in addition to those who did not complete vaccination status questions.
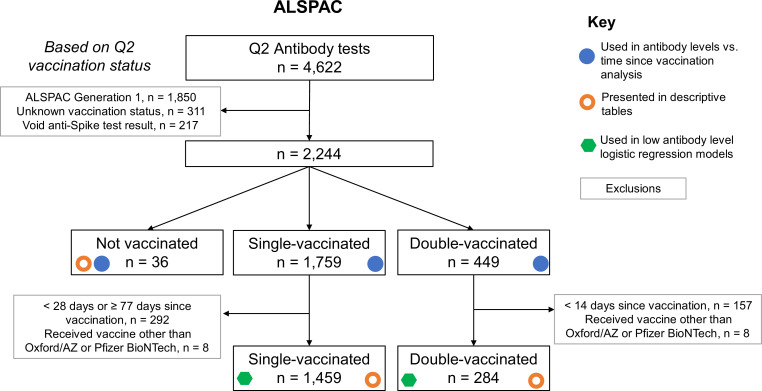
Figure 1—figure supplement 3. Flow chart showing identification of analysis samples from Q2 antibody testing within Avon Longitudinal Study of Parents and Children (ALSPAC).

Figure 1—figure supplement 3.

The use of groups of individuals in various analyses is highlighted with symbols. Unknown vaccination status included a small number of individuals with contradictory vaccination dates (e.g., first vaccination dated after second vaccination), in addition to those who did not complete vaccination status questions.
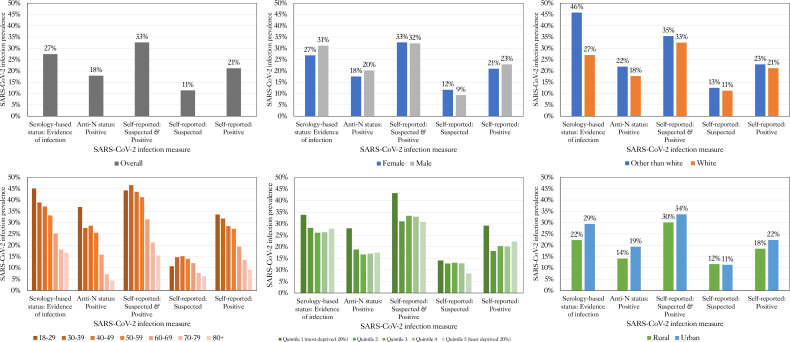
Figure 1—figure supplement 4. SARS-CoV-2 infection prevalence by socio-demographic factors in TwinsUK.

Figure 1—figure supplement 4.

Prevalence of severe acute respiratory syndrome coronavirus 2 (SARS-CoV-2) infection for serology-based and self-reported measures of infection, for all individuals sampled in TwinsUK Q4 antibody testing, overall and split by socio-demographic variables: age, sex, ethnicity, local area deprivation (IMD), and rural-urban classification. Anti-N: anti-Nucleocapsid.