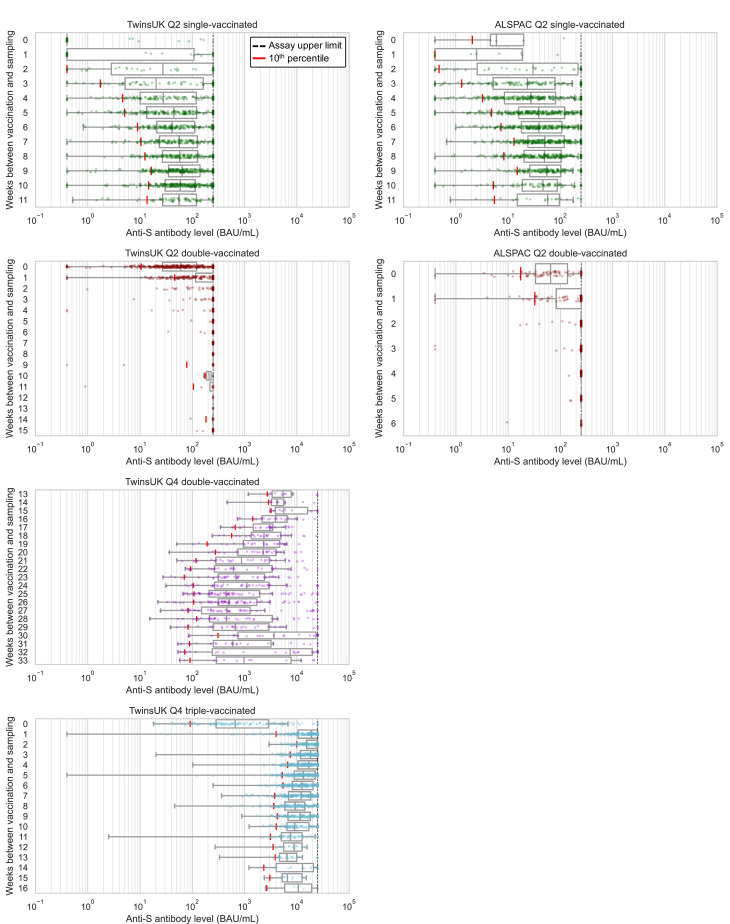
Figure 2. Anti-Spike antibody levels versus time since most recent vaccination, stratified by cohort and vaccination status at Q2 and Q4 antibody testing.
Dot and box plots showing distribution of anti-Spike (anti-S) antibody levels within unvaccinated, single-, double- and triple-vaccinated individuals within Avon Longitudinal Study of Parents and Children (ALSPAC) (Q2 testing) and TwinsUK (Q2 and Q4 testing), plotted against the number of weeks since most recent vaccination at time of sampling. Length of box plot whiskers are limited to 1.5 times the interquartile range. Red lines show 10th percentile levels. Assay upper limit is shown by black dotted lines, with 0.4–250 BAU/mL range for Q2 results and 0.4–25000 BAU/mL for Q4 results, with a positive threshold of 0.8 BAU/mL. X-axes are limited to weeks with results for five or more individuals, noting TwinsUK Q4 second vaccination sub-plot begins at 13 weeks since vaccination.

