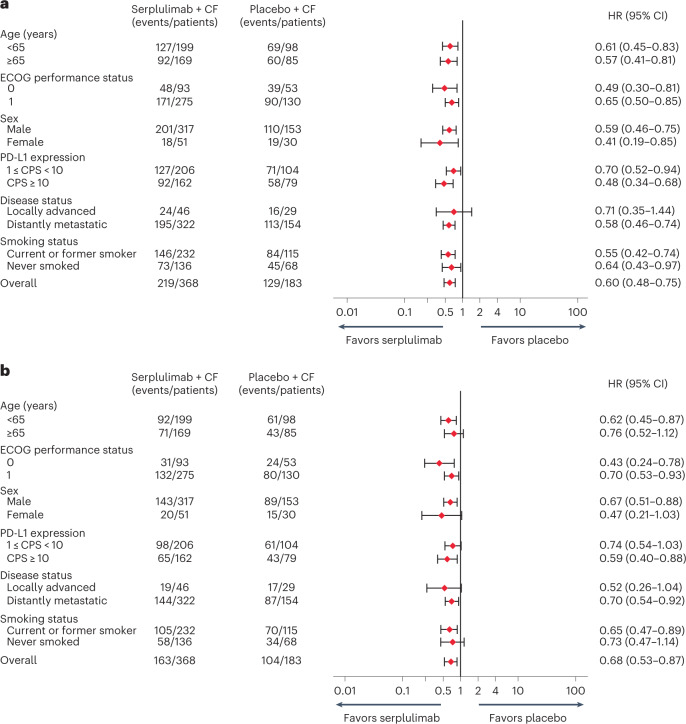
Fig. 4. Survival by patient subgroups.
a,b, Forest plot analysis of PFS (a) and OS (b) in prespecified and post-hoc (smoking status) subgroups in the ITT population for patients receiving serplulimab plus chemotherapy (n = 368) versus placebo plus chemotherapy (n = 183). PFS was assessed in accordance with RECIST v1.1 by the IRRC. The Cox proportional hazards model with Efron’s method of tie handling was used to assess the magnitude of the treatment difference between groups. Sex was recorded by the investigators according to the identity information provided by the patients.

