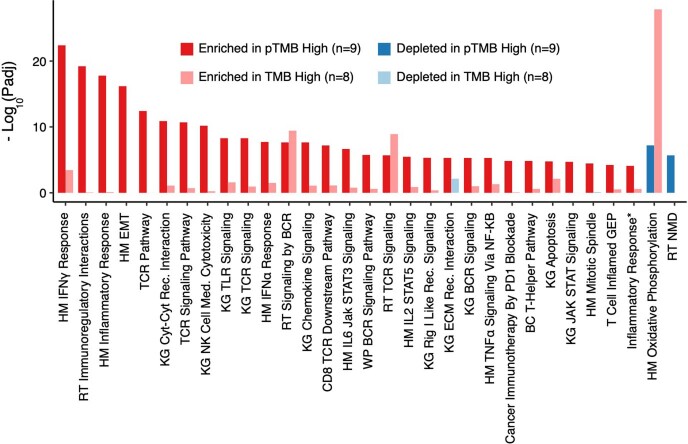
Extended Data Fig. 9. Transcriptomic profiling of on-immunotherapy melanomas reveals an upregulation of inflammatory pathways in tumors harboring a high pTMB.
Gene set enrichment analyses of on-treatment pTMB-high (n = 9) vs. pTMB-low (n = 22) melanomas revealed a marked enrichment of interferon-γ and inflammatory responses in the tumor microenvironment of pTMB-high vs pTMB-low tumors after ICB. In contrast, this profile was not observed in the tumor microenvironment of TMB-high (n = 8) compared to TMB-low (n = 23) melanomas. Pathways with a minimum adjusted p-value of 1e-05 in pTMB high vs low comparison are shown. The T Cell Inflamed GEP gene set was derived from Cristescu et al., Science, 2018 and the Inflammatory Response gene set was derived by Ayers et al., J Clin Invest, 2017, while the remainder of gene sets were included in the Molecular Signatures Database (Methods). Nominal two-sided p-values are calculated using permutation testing and FDR adjusted p-values shown for gene set differential expression are provided for comparison of pTMB/TMB-high vs low groups. Abbreviations; BC: Biocarta, HM: Hallmark, KG: KEGG, RT: Reactome, EMT: Epithelial–mesenchymal transition, Cyt: Cytokine, Rec: Receptor, Med: Mediated.

