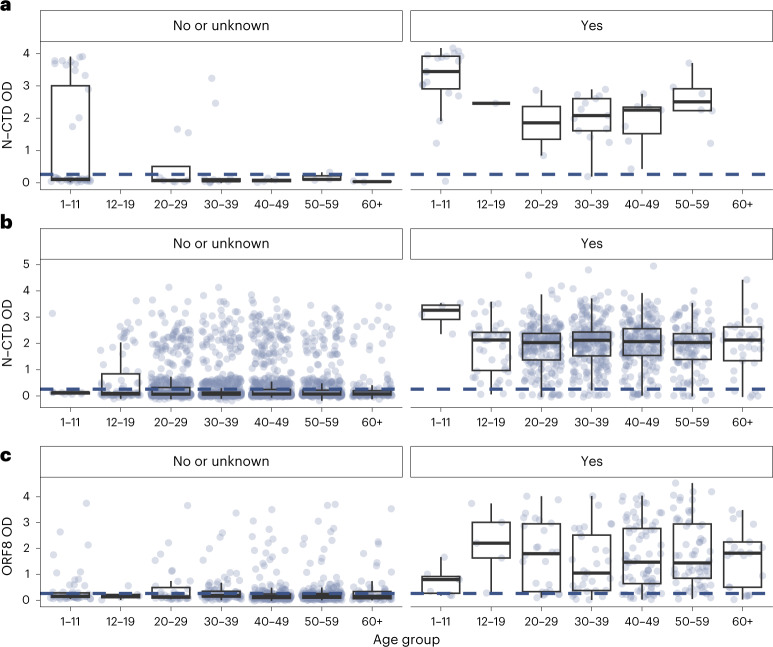
Fig. 2. SARS-CoV-2 N-CTD and ORF8 antibody responses among study subjects by vaccination history, age and self-reported infection history.
a–c, Unvaccinated (n = 116 subjects) (a), BNT homologously vaccinated (n = 3,759 subjects) (b) and CoronaVac homologously vaccinated (n = 906 subjects) (c). Panels on the left correspond to individuals with no self-reported infection history or who did not provide their infection history. Panels on the right correspond to individuals with self-reported infection history. The blue dotted line corresponds to the OD thresholds for seropositivity (N-CTD OD of 0.2583 for unvaccinated and BNT homologously vaccinated, and ORF8 OD of 0.33 for CoronaVac homologously vaccinated). Each dot represents one study subject. The center line of each box represents the median, box limits represent the interquartile range (IQR), and the whiskers represent the minimum and maximum observations greater and lesser than the IQR plus 1.5× IQR, respectively.

