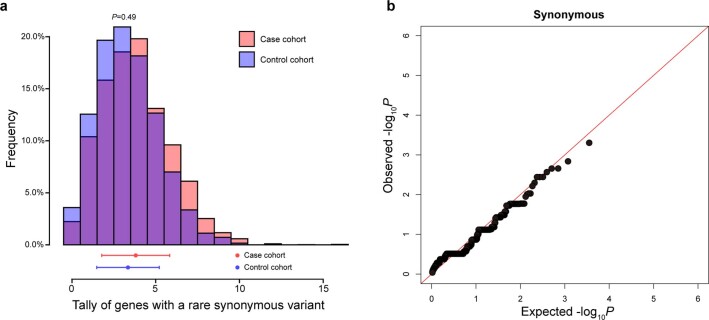
Extended Data Fig. 6. Association analyses of synonymous variants.
a, Rates of gene with rare synonymous qualifying variants in 703 POI candidate genes. The upper panel shows the distribution of tally of genes carrying at least a rare synonymous qualifying variant among all tested genes when comparing the POI case cohort (red distribution, n = 1,030) to the control cohort (blue distribution, n = 5,000). We found no statistically significant difference between case and control contribution (two-sided Wilcoxon rank sum test, P = 0.49). The lower panel shows mean (points) and SD (bars) of qualifying genes of the case cohort (red) and the control cohort (blue). b, The quantile-quantile plot of the expected versus observed P values comparing the burden of synonymous variants in 703 genes (two-sided Fisher’s exact test). There is no significant inflation between the case and control cohort.

