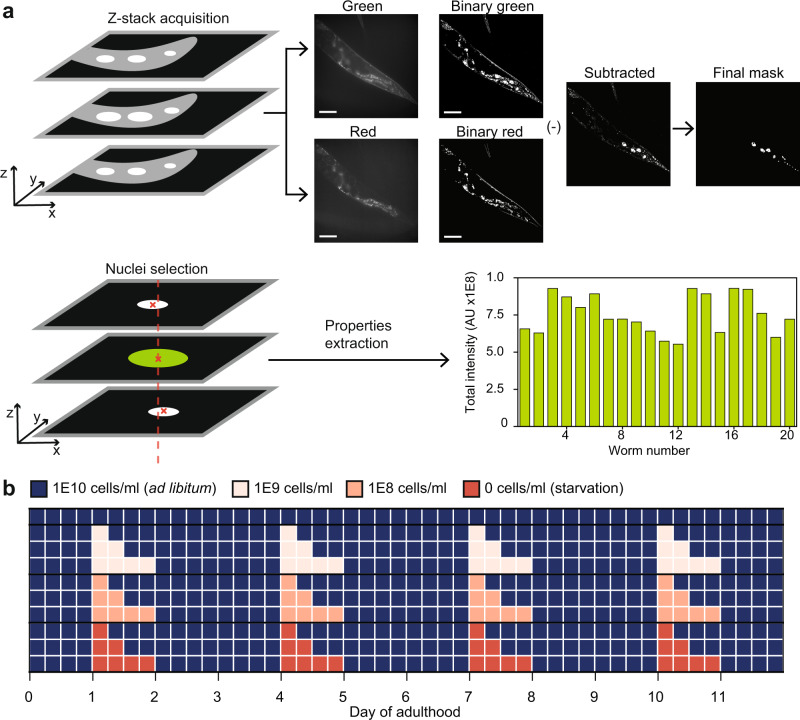
Fig. 1. Quantitative analysis of endogenous DAF-16 under dietary restriction regimes.
a Four Z-stacks of 30 slices are taken of each animal. Each slice in the green channel has a corresponding red channel slice. Both are converted to binary images and subtracted from each other to eliminate autofluorescence. The resulting image is treated with morphological functions and objects are filtered based on extent, solidity, and eccentricity. An image containing only cell nuclei is obtained, and largest nuclei are retained if they appear in several slices. Pixel-based intensity is then aggregated to obtain total DAF-16 intensity in all of the animal’s identified nuclei. b Diagram of DR regimes tested in this study. Animals were exposed to three levels of DR: 1E9, 1E8, or 0 OP50 cells/ml; for three exposure times: 6, 12, or 24 h. After each exposure, animals were put back in an ad libitum concentration (1E10 OP50 cells/ml). Exposure to DR was performed at Days 1, 4, 7, and 10 of adulthood. Scale bars are 50 µM.

