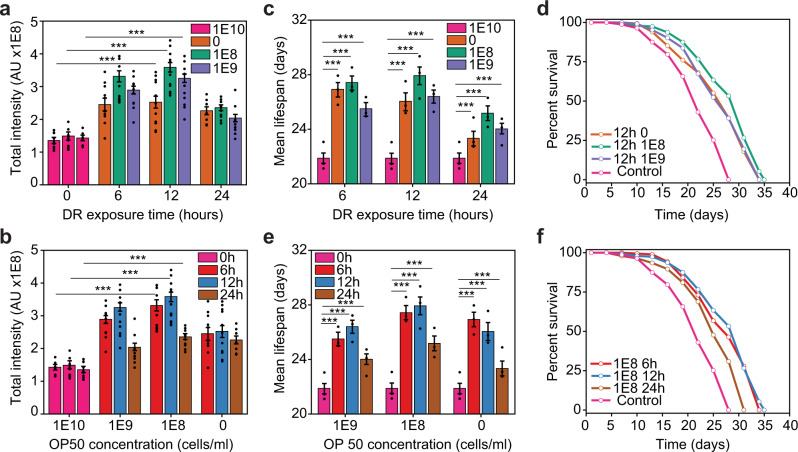
Fig. 2. DR regimes modulate endogenous DAF-16 activity.
a DAF-16 total intensity as a function of exposure time to DR for various food concentrations at Day 1 of adulthood. b DAF-16 total intensity as a function of food concentration for various exposure times at day 1 of adulthood. c Mean lifespan as a function of exposure time at various food concentrations. d Lifespan curves for populations under various food concentrations with 12 h of exposure to DR. e Mean lifespan as a function of food concentration at various exposure times. f Lifespan curves for populations under various exposure times to DR with a 108 OP50 cells/ml food concentration. p < 0.001 (***). Error bars are SEM. All p-values were calculated using Tukey HSD for all pairwise comparisons after one-way ANOVA (unequal variances) comparison. Control population (pink) is ad libitum (1E10 cells/ml, 0 h exposure time).

