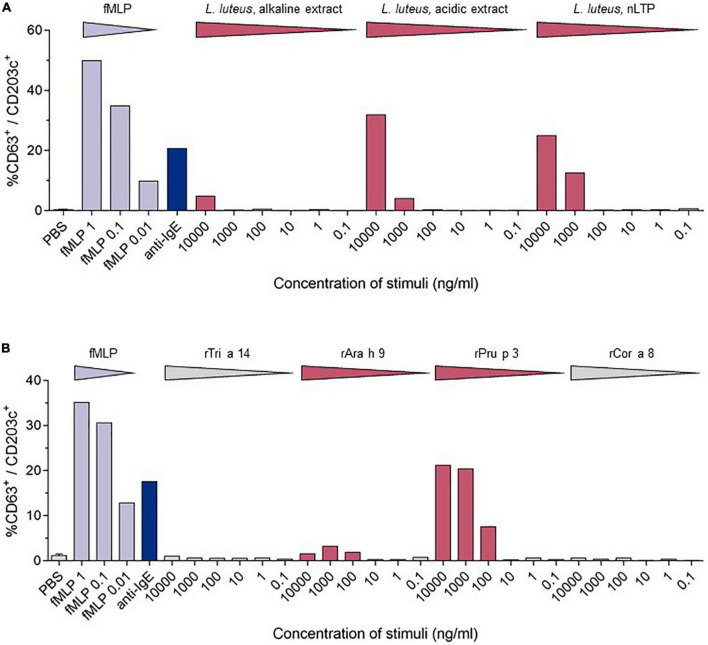
FIGURE 2.
Comparison of the stimulation-induced basophil activation levels. Basophil activation was measured by the percentages of CD63 positive basophils (CD203c+/FcϵRIα+). PBS—phosphate-buffered saline, fmIP- formyl-, methionyl-leucyl phenylalanine. (A) Results of the BAT for LTPs from Lupinus luteus [acidic extract; alkaline extract; nLup l 3 (LTP)] (10). (B) BAT results from wheat (rTri a 14), peanut (rAra h 9), peach (rPru p3), and hazelnut (rCor a 8).

