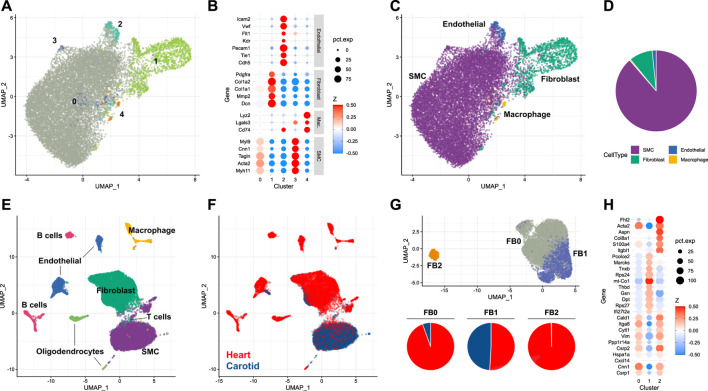
FIGURE 1.
Single-cell analysis of the naive murine carotid artery (A) Uniform manifold approximation projection (UMAP) plot of cells isolated from homeostatic carotid arteries, with clusters assigned by Seurat. (B) Scaled expression of cell-type marker genes in each cell cluster. (C) UMAP plot of cells coloured by assigned cell type. (D) Proportions of cells assigned as smooth muscle cells (SMC), fibroblasts, endothelial cells and macrophages. (E, F) Integration of single-cell RNA-sequencing data from carotid and cardiac tissues. (G) Re-clustering of integrated fibroblasts, and proportions of each cluster originating from either carotid or cardiac tissue. (H) Cluster marker genes for each integrated fibroblast cluster.

