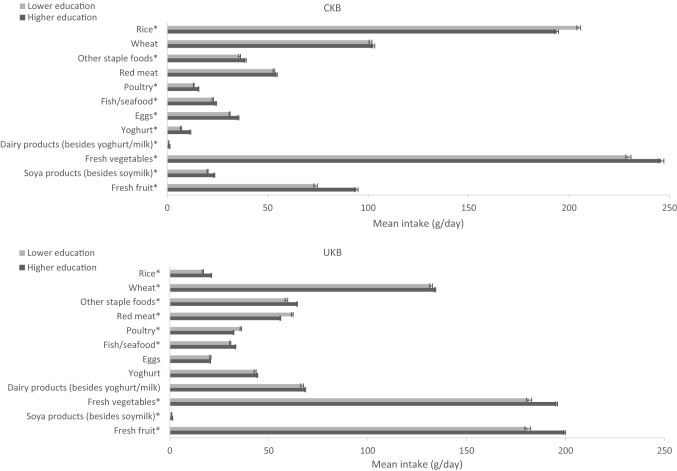
Fig. 2.
Adjusteda mean intake (g/day) of food groups in participants with lower and higher levels (medium and high combined) of education in CKB and UKB. aAdjusted for age (< 45, 45–49, 50–54, 55–59, 60–64, and ≥ 65 years), sex (men and women), region (10 relevant for each cohort) and income (lower [low and medium combined] and higher levels). More details on the definitions of lower and higher levels of education in each study can be found in Table 1. In CKB the mean intake of dairy products (besides yoghurt and milk) was 0.8 and 1.3 g/day in the lower and higher education groups, respectively; in UKB the mean intake of soya products was 1.0 and 1.4 g/day in the lower and higher education groups, respectively. Phet < 0.01 for fixed-effects meta-analysis between CKB and UKB low education levels and CKB and UKB high education levels. *P < 0.05 for independent Student’s T test between CKB low and high education and UKB low and high education

