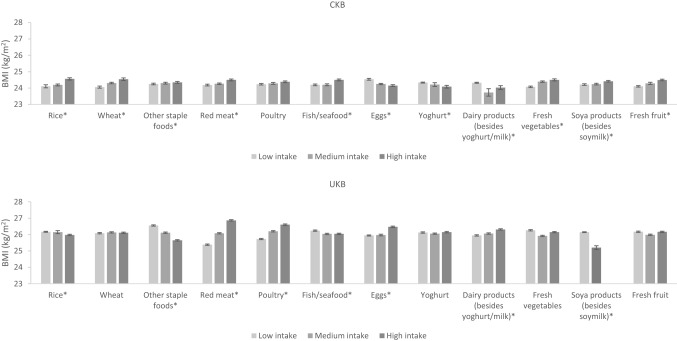
Fig. 4.
Adjusteda mean BMI by intake of food groups in CKB and UKB in women. aAdjusted for age (< 45, 45–49, 50–54, 55–59, 60–64, and ≥ 65 years), region (10 relevant for each cohort), education level (low, medium, high), income level (low, medium, high), smoking (never, ex-smoker, current smoker), physical activity (quartiles of metabolic equivalent of task hours per day in CKB and quartiles of metabolic equivalent of task hours per week in UKB), and alcohol (never, ex-drinker, current drinker in CKB and never, current drinker in UKB). In CKB intake of food groups was divided into tertiles where possible or low, medium and high intake corresponding to never/rarely, monthly and weekly intake, respectively. In UKB intake of food groups was divided into tertiles where possible or ‘none’ versus ‘any’ where intakes were too low. *P trend < 0.05 across the intake groups

