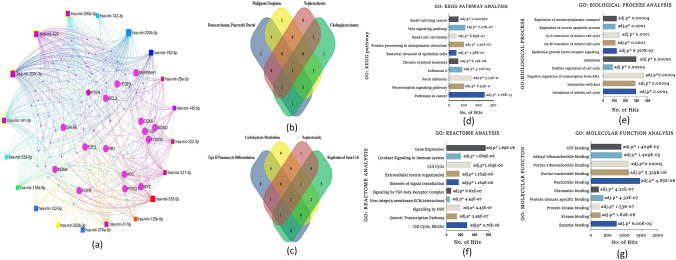
Fig. 7.
a miRNA–mRNA interactions network of highly expressed miRNAs in primary and metastatic colon cancer using the MiRNet database. b Venn diagrammatic representation of miRNAs distribution in functional enrichment analysis. c Venn diagrammatic representation of interacting nodes distribution in biological process analysis. d GO KEGG analysis of interacting nodes with highly expressed miRNAs with top ten pathway class having highly significant p value e GO biological process analysis of interacting nodes with highly expressed miRNAs with top ten pathway class having highly significant p value. f GO Reactome analysis of interacting nodes with highly expressed top ten miRNAs having highly significant p values. g Molecular functional analysis of highly expressed miRNAs with top ten function class having highly significant p value

