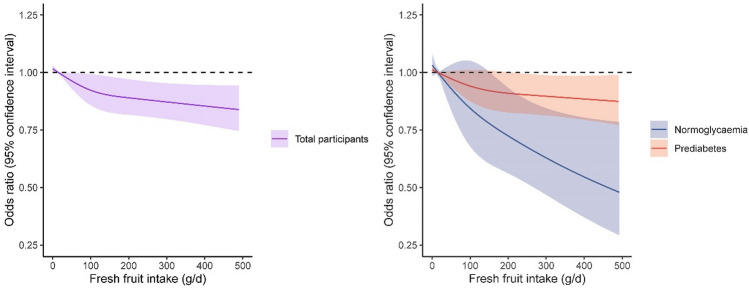
Fig. 2.
The cubic spline analysis of the association of incident diabetes with daily fresh fruit intake. The solid lines indicate multivariate adjusted odds ratios and the dashed lines indicate the 95% confidence intervals derived from the restricted cubic spline regression. A knot is located at the 25th, 50th, and 75th percentiles for daily level of fresh fruit intake. The Logistic regression model was adjusted for age, sex, study area, BMI, waist circumference, family history of diabetes, smoking, drinking, education status, physical activity, systolic blood pressure, HDL-C, LDL-C, and triglycerides, and other major dietary consumption components. P for lin = 0.0363, and P for non_lin_association = 0.1213 in total participants. P for lin = 0.1988, and P for non_lin_association = 0.6981 in prediabetes participants. P for lin = 0.0864, and P for non_lin_association = 0.1812 in normal glucose participants

