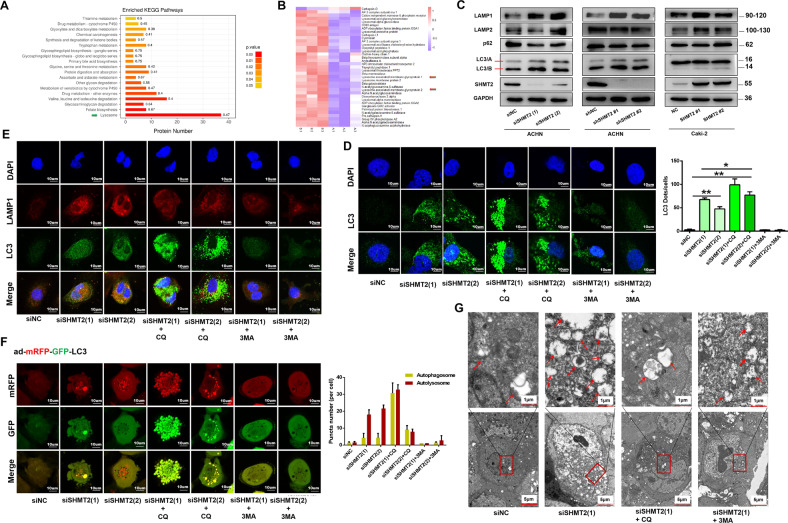
Fig. 4. SHMT2 knockdown in ccRCC cells induced the autophagy-lysosome pathway and affected autophagic flux.
A Top enriched KEGG pathways based on the differentially expressed proteins between shSHMT2 and shNC ACHN cells. The abscissa represented the number of differentially expressed proteins in each pathway. The color of the bar chart indicated the significance of the enriched KEGG pathways. B Heat-map of 37 differentially expressed proteins involved in the lysosome pathway. Red represented significantly upregulated proteins and blue represented significantly downregulated proteins after SHMT2 knockdown. Red arrows indicated the LAMP1 and LAMP2. A represented shNC, and B represented shSHMT2. C The levels of autophagy-lysosome-related proteins after knockdown or overexpression of SHMT2 in ccRCC cells. D Immunofluoresence analysis of LC3 (green) in ACHN cells after SHMT2 knockdown alone or in combination with CQ (20uM) or 3-MA (5 mM) for 48 h. Nuclei were stained with DAPI. E Double immunofluoresence analysis of the co-localization of LC3 (green) and LAMP1 (red) in ACHN cells after SHMT2 knockdown alone or in combination with CQ (20uM) or 3-MA (5 mM) for 48 h. Nuclei were stained with DAPI. F ACHN cells were transfected with adenovirus harboring mRFP-GFP-LC3 (green and red puncta indicate GFP and mRFP, respectively) to follow autophagic flux, after SHMT2 knockdown following treatment with CQ (20uM) or 3-MA (5 mM). Nuclei were stained with DAPI (left). Quantitative analysis of autophagosomes (yellow dots) and autolysosomes (red dots) (right). G TEM analysis revealed that autolysome formation was induced after SHMT2 knockdown in ACHN cells. Red arrows indicated autolysosomes or autophagosomes. The scale bars in the original image and the enlarged image represented 5 μm and 1 μm, respectively. *P < 0.05, **P < 0.01.

