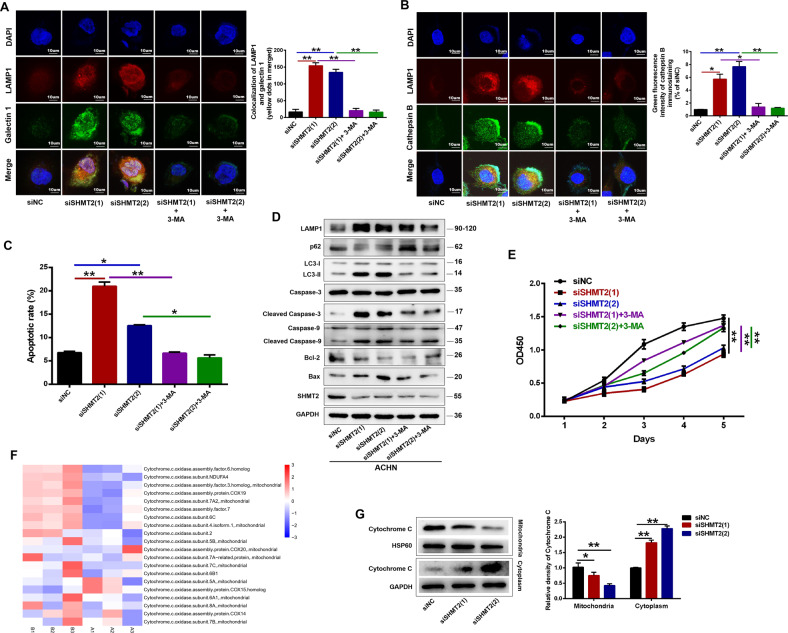
Fig. 5. Inhibition of autophagy reduced SHMT2 knockdown-induced LMP and apoptosis in ccRCC cells.
A Double immunofluorescence analysis of the co-localization of galectin-1 (green) and LAMP1 (red) in ACHN cells after SHMT2 knockdown alone or in combination with 3-MA (5 mM) for 48 h. Nuclei were stained with DAPI. Green Galectin punctea indicated compromised lysosomes (left). Co-localization of galectin 1 and LAMP1 was quantified using NIH Image J (right). B Double immunofluorescence staining of cathepsin B (green) and LAMP1 (red) in ACHN cells after SHMT2 knockdown following treatment with 3-MA (5 mM). Nuclei were stained with DAPI (left). Quantification of green fluorescence intensity of cathepsin B immunostaining (right). C Quantitative FACS apoptosis results in ACHN cells after SHMT2 knockdown alone or in combination with 3-MA (5 mM) for 72 hours. D The expression levels of autophagy-lysosome-related proteins and apoptosis markers were analyzed by western blot in ACHN cells after SHMT2 knockdown following treatment with 3-MA (5 mM) for 72 hours. GAPDH served as loading control. E Cell proliferation assay of ACHN cells after SHMT2 knockdown following treatment with 3-MA (5 mM). Error bars represent SD (n = 3). F Heat-map of 20 differentially expressed cytochrome.c.oxidase subunits between shNC and shSHMT2 cells. Red represented significantly upregulated proteins and blue represented significantly downregulated proteins after SHMT2 knockdown. A represented shNC, B represented shSHMT2. G Western blot analysis of mitochondrial and cytosolic cytochrome c levels after SHMT2 knockdown in ACHN cells. GAPDH or HSP60 was used as the loading control for cytoplasm and mitochondria, respectively. *P < 0.05, **P < 0.01.

