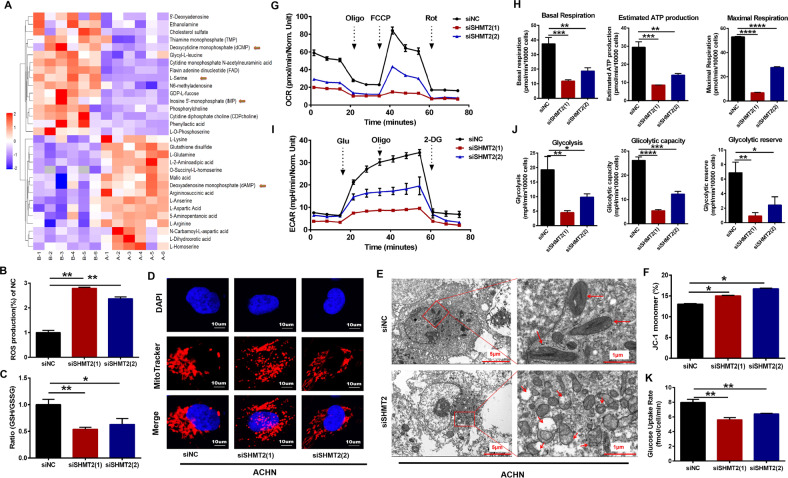
Fig. 6. Effects of SHMT2 knockdown on metabolic reprogramming and mitochondrial structure in ACHN cells.
A Heatmap of differentially accumulated metabolites between shNC and shSHMT2 ACHN cells based on the LC-MS metabolite profile. A represented shNC, B represented shSHMT2. B ROS labeled by DCF-DA were detected by flow cytometry after SHMT2 knockdown in ACHN cells. All values were normalized to siNC control values. C Cellular GSH/GSSG ratios were measured using a GSH/GSSG-Glo Assay kit. All values were normalized to siNC control values. D Representative confocal microscopy images of ACHN cells stained with Mito tracker (red) and DAPI nuclear staining (blue). Red fluorescence indicated the active mitochondria. E TEM analysis demonstrated the ultrastructure changes of mitochondria after SHMT2 knockdown in ACHN cells. Red arrows indicated mitochondria. The scale bars in the original image and the enlarged image represents 5 μm and 1 μm, respectively. F Quantification of the monomeric JC-1 levels, indicating a decrease in MMP after treatment with siSHMT2. G OCR measurements in ACHN cells after SHMT2 knockdown. H Basal respiration, estimated ATP production, and maximal respiration based on OCR results. I ECAR measurements in ACHN cells after SHMT2 knockdown. J Glycolysis, glycolytic capacity, and glycolytic reserve based on ECAR results. K Glucose uptake was measured using Promega glucose uptake-Glo assay kit.

