Figure 2.
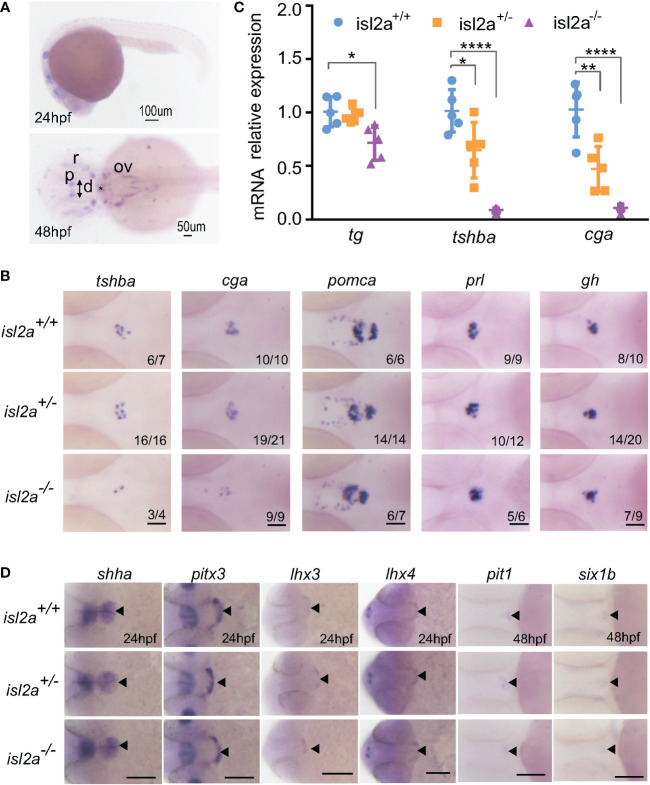
Effect of isl2a knockout on the expression of genes involved in pituitary development via whole-mount in situ hybridization. (A) Spatiotemporal expression patterns of isl2a by whole-mount RNA in situ hybridization at 24 and 48 hpf. Scale bars = 100 µm/50 µm. Asterisks (*) indicate the position of midbrain-hindbrain boundary. p, pineal gland; r, retinal; ov, otic vesicle; d, diencephalon. (B) Knockout of isl2a resulted in reduced tshba and cga expression, while the expression of pomca, prl, and gh was not changed in larvae at 3 dpf. Pituitary precursors differentiate into specific cell types with markers, including gh (for somatotropes), tshba (for thyrotropes), cga (for thyrotropes and gonadotropes), prl (for lactotropes), and pomca (for corticotropes and melanotropes). All images are dorsal views with the head pointing towards the left. Scale bar = 50 µm. Numbers indicate the ratio of embryos with the shown phenotype. (C) qRT-PCR analysis demonstrates the expression of total tg, tshba and cga in isl2a+/+ , isl2a+/− and isl2a−/− larvae at 3 dpf. Data is represented as mean ± SD (n = 5, 15 fish per tube). *P<0.05, **P<0.01, ****P<0.001. (D) Ventral views of embryos at 24 hpf show no differences in shha, pitx3, lhx3 and lhx4 expression in isl2a mutants. Dorsal views of embryos at 48 hpf show no difference in gene expression, indicating specification of pit-1 lineage (pit1, for somatotropes, thyrotropes, and lactotropes) or non-pit-1 lineage (six1b for corticotropes, gonadotropes, and melanotropes). Thus, pituitary induction and lineage specification were unaffected in isl2a mutants. Scale bar = 100 µm. The black triangle indicates gene expression in the adenohypophyseal placode.

