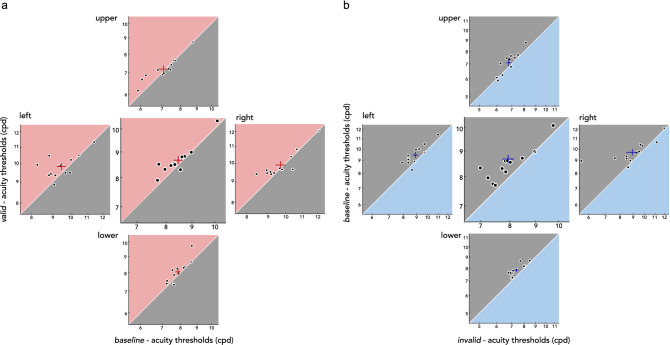
Figure 4.
Individual participant’s presaccadic benefits and costs on acuity. (a) Acuity benefits during saccade preparation are demonstrated by plotting the acuity thresholds for the valid condition (y-axis) against the baseline condition (x-axis). (b) Acuity costs during saccade preparation are shown by plotting the acuity thresholds for the baseline condition (y-axis) against the invalid condition (x-axis). For both (a) and (b), the center plots show thresholds collapsed across all four locations. Crosses denote mean 1 SEM. Note that the range plotted differs between locations, to account for visual field asymmetries.

