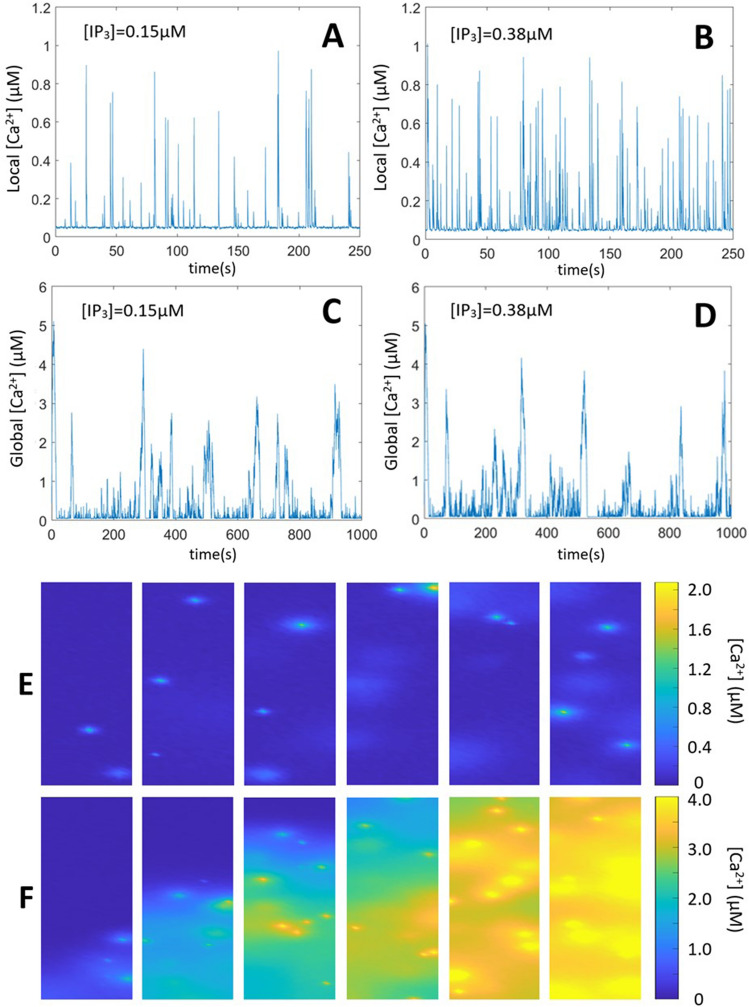
Figure 2.
Stochastic simulations of Ca2+ puffs and spikes. (A and B) show the evolution of Ca2+ concentration in a 1 fL volume (1.5 × 1.5 μm2 in the 2D simulations, see Voorsluijs et al.9) centered around the cluster at two [IP3]. For the 2 panels, one cluster, located at the centre of a 5 × 5 μm2 2D system is considered. For panels (C and D), a larger 5 × 10 μm2 system containing 10 clusters is simulated. All values of parameters are the same as in A and B and listed in Table S2. Time series show the evolution of Ca2+ concentration averaged on the whole system. Panels (E and F) show the spatio-temporal evolutions of Ca2+ puffs and spikes, respectively. In the two cases, the system is 50 × 10 μm2 large and 10% of the total surface is occupied by clusters (200 clusters). For panel E, [IP3] is constant and equal to 0.075 μM everywhere in the cell. For panel F, IP3 was released in one spot (with dimensions 0.5 × 0.5 μm2) located in the bottom center of the simulated cell. For panels E and F, times corresponding to each subpanels are: 0.1, 0.6, 2.5, 3.4 and 5.2 s after the increase in [IP3] from 10 nM. In panels A-E, [IP3] is increased at time 0, and Eqs. (3) and (5) are not considered. In panel F, the release of IP3 is simulated using Eq. (3), with = 1000µMs−1, DI = 100 μm2s−1 and tph = 500 ms.

