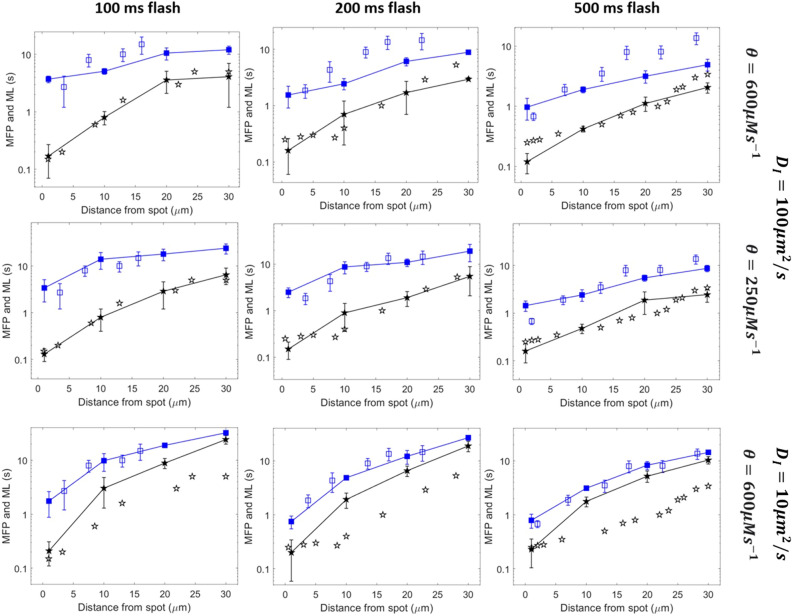
Figure 4.
Mean latencies (ML) and minimal first puff latencies (MFP) as simulated with an effective IP3 diffusion coefficient equal to 100 μm2s−1 (first and second rows) or 10 μm2s−1 (third row) and a rate of IP3 increase at the photorelease spot of 600 μMs−1 (first and third rows) or 250 μMs−1 (second row). In all panels, squares represent mean latencies and stars, minimal first puff latencies. Plain symbols are theoretical predictions while empty symbols are the experimental observations of Dickinson et al.11, estimated from their figures. Lines are drawn between simulation results. Simulations are performed in a 2D ellipse-shaped geometry with the spot of IP3 release occurring in a 0.25 μm radius circle at one extremity of the simulated cell. For each theoretical point, 50 independent simulations were run, considering one cluster at a time. Error bars indicate ± SEM. For minimal first puffs, the 50 simulations were divided in 10 groups of 5 simulations among which the minimal first puff was considered, except for the case θ = 250 μMs−1 and the 500 ms flash for which 100 simulations were run for the shortest distance.

