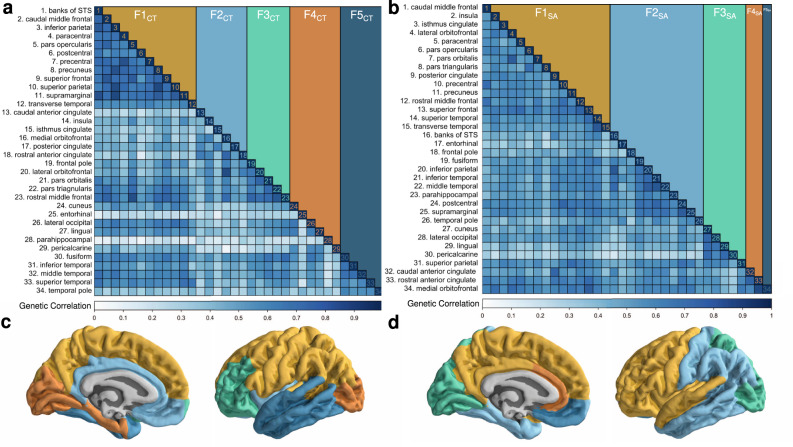
Fig. 2. Genomic factor analysis of the cerebral cortex.
a, b Heatmaps illustrating the genetic relationships between cortical regions for a CT and b SA, as estimated with Genomic SEM. Genetic correlations are reported in the lower triangle while factor membership is illustrated in the upper triangle. Cortical regions are ordered with respect to the factor model results. c, d Categorical brain maps depicting the brain regions that correspond to each genomic cortical factor for c CT and d SA. Color coding is consistent throughout the figure.

