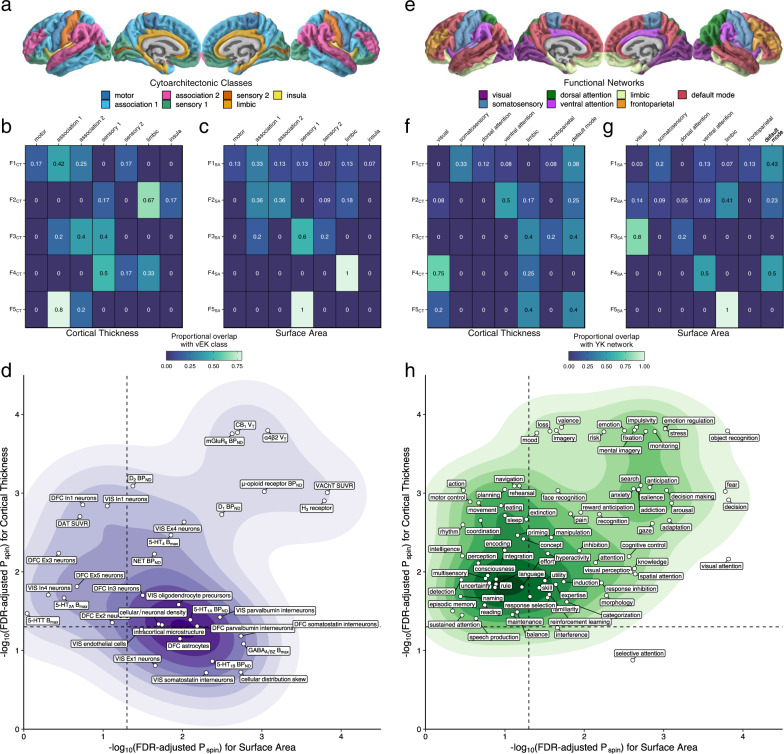
Fig. 3. Topographical annotation of genomic cortical thickness and surface area factors.
a Map of cytoarchitectonic classes defined by von Economo and Koskinas (vEK)15. b, c Marginal table of proportional overlap between b cortical thickness (CT) and c surface area (SA) and the vEK cytoarchitectonic classes. d Two-dimensional density plot of significant overlap between cortical factors and biologically derived features of the cortex (from the BigBrain project, Allen Human Brain Atlas, and positron emission tomography meta-analysis; “Methods”). Two-sided p-values were calculated using the spin-based test. The dashed line denotes statistical significance on a −log10 scale after correcting for multiple comparisons using the false discovery rate (FDR). e Map of canonical resting-state functional connectivity networks defined by Yeo and Krienen (YK)16. f, g Marginal table of proportional overlap between f CT and g SA and the YK networks. h Two-dimensional density plot of significant overlap between cortical factors and patterns of functional activation associated with psychological processes (from Neurosynth; “Methods”). As in panel (d), two-sided p-values were calculated using the spin-based test and the dashed line denotes statistical significance on a −log10 scale after correcting for multiple comparisons using FDR.

