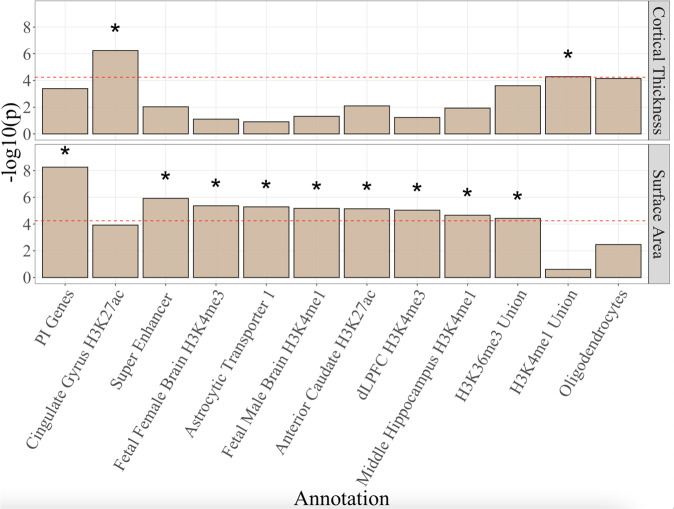
Fig. 4. Functional enrichment for general factors.
The figure depicts the 11 annotations that were Bonferroni significant for the general factor from the bifactor model for either surface area or cortical thickness, along with the oligodendrocytes annotation that was just below the Bonferroni threshold for CT (p = 7.11E-5). Both panels depict the −log10(p) values on the multivariate enrichment estimate from Stratified Genomic SEM. p-values are one-tailed and were calculated using the ratio of the enrichment estimate over its standard error. We correct for multiple testing for Stratified Genomic SEM results by employing a strict Bonferroni correction for the number of annotations (152) and factors (6) analyzed (i.e., p < 5.48E-5). Bars significant at a Bonferroni-corrected threshold (shown as a red dashed line) are depicted with a “*”. Bars are ordered with respect to the level of significance across both CT and SA.

