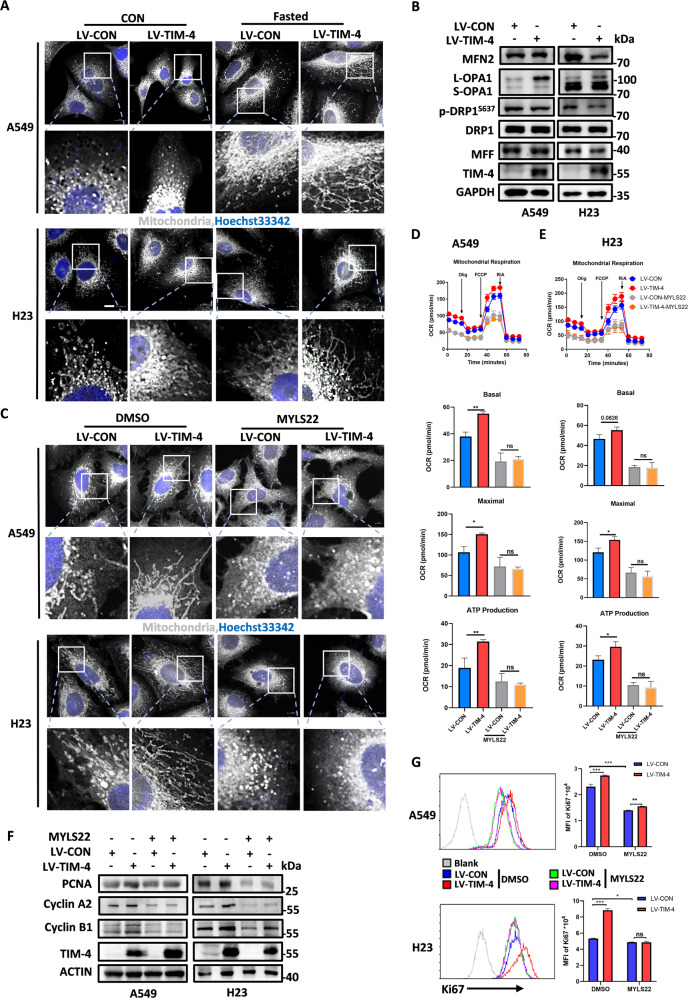
Fig. 3. TIM-4 promotes mitochondrial fusion and function by increasing the level of L-OPA1.
A Representative confocal micrographs of mitochondrial morphology in A549 and H23 cells. Mitochondria were visualized by anti-TOM20 immunostaining (gray), Hoechst 33342 labels nuclei (blue). The scale bar represents 10 μm. B Levels of proteins involved in mitochondrial dynamics (MFN2, OPA1, p-DRP1, DRP1, and MFF) were detected by western blotting in A549 and H23 cells. C A549 and H23 cells transfected with LV-CON and LV-TIM-4 were treated with MYLS22 (50 μM) for 24 h, then cells were subjected to anti-TOM20 (gray), DAPI Hoechst 33342 staining (blue), scale bar = 10 μm. D, E OCR, mitochondrial basal respiration and maximal respiration of A549 and H23 cells treated with inhibitor of OPA1 (MYLS22: 50 μM) for 24 h. F The expression levels of cell proliferation marker PCNA and cell cycle-related proteins including Cyclin A2, Cyclin B1 were determined by western blotting in A549 and H23 cells treated with MYLS22 for 24 h. G Flow cytometry histograms showing the level of Ki67 in lung cancer cell lines treated with MYLS22 for 24 h. Three independent experiments were conducted for each result and error bars represent SEM per group in one experiment. Data were analyzed using Student’s t test (two-tailed unpaired t test) for (D), (E), and (G). ns means non-significance; *P < 0.05; **P < 0.01; ***P < 0.001.

