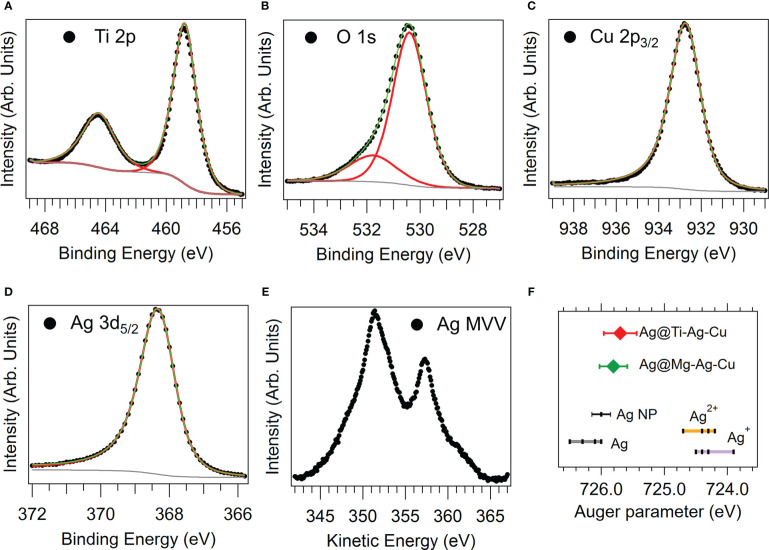
Figure 2.
Spectroscopic characterization of the Ti-Ag-Cu sample. (A) Ti 2p, (B) O1s, (C) Cu 2p (only the 2p3/2 component is shown), (D) Ag 3d (only the 3d5/2 component is shown), and (E) Ag MVV Auger emission spectra. (F) Scheme of the Auger parameters obtained for the Ti-Ag-Cu (red diamond) and Mg-Ag-Cu (green diamond) samples.

