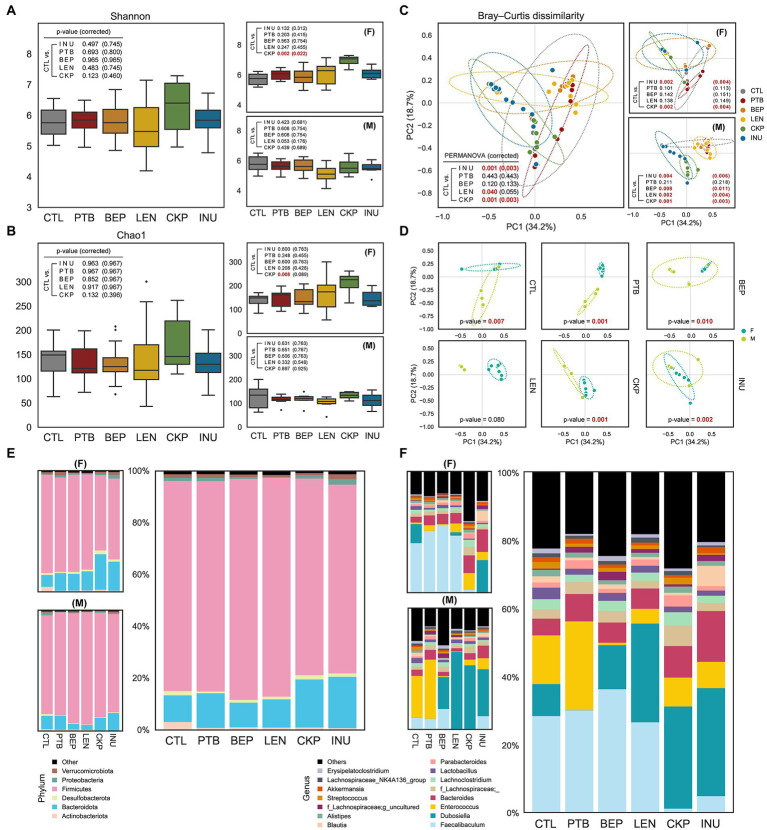
Figure 2.
Effect of resistant starches from dietary pulses on gut microbiome diversity and taxonomic hierarchies. Alpha-diversity of microbiome of each group determined using (A) Shannon index and (B) Chao1 index. (C) PCoA analysis representing β-diversity of microbiome of each group combined or male and female groups. (D) Sex-specific differences in microbiome composition for each group; covariance ellipses are displayed and bounds (dotted lines) of each group with two standard deviations (2σ) in each direction from the group mean. Relative abundance of gut microbiome in male and female mice or all combined at (E) phylum level and (F) genus level. PTB, Pinto beans; BEP, black-eyed peas; LEN, Lentils; CKP, chickpeas; INU, inulin; CTL, control high-fat diet group. *p < 0.05.

