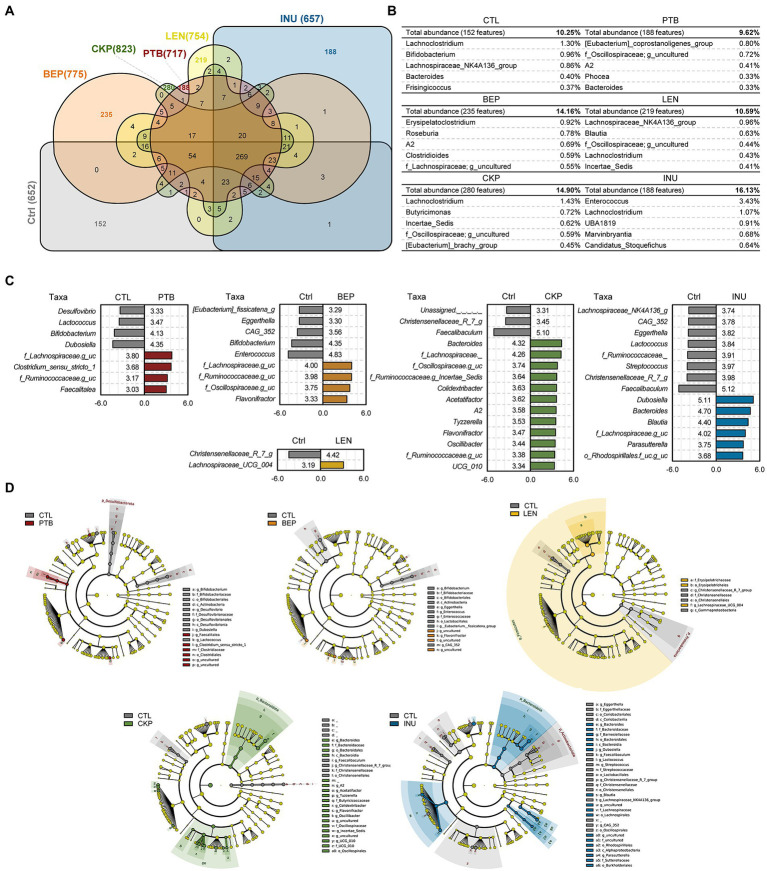
Figure 3.
Comparison of unique microbiome features and discriminatory taxa between prebiotics (resistant starches and inulin) versus control groups. (A) Venn diagram illustrating unique and shared features (ASVs) among different groups. (B) Unique features expanded to display top 10 genera with relative abundance of unique features of each group. (C) Bacterial composition differences between groups analyzed with Linear discrimination analysis (LDA) effect size (LefSe) algorithm; x-axis: LDA score. (D) LEfSe cladogram depicting differentially abundant taxa between groups. PTB, Pinto beans; BEP, black-eyed peas; LEN, Lentils; CKP, chickpeas; INU, inulin; CTL, control high-fat diet group.

